This page contains links to data and graphics associated with the SADCP climatology in the Solomon Sea.
Reference: S. Cravatte, A. Ganachaud, Q.-P. Duong, W. Kessler, G. Eldin and P. Dutrieux, 2011. Observed circulation in the Solomon Sea from SADCP data, Prog. Oceanogr., doi:10.1016/j.pocean.2010.12.015
Raw data
- IRD-SADCP (IRD-Noumea)
- Joint Archive for Shipboard ADCP (University of Hawaii)
- MARLIN (CSIRO)
Processed data
- After the standard CODAS processing, ADCP profiles were further filtered for each cruise according to the following procedure: a) hourly averaging; b) detection of velocities larger than 2.5 standard deviations from the 20 closest profiles in time at each depth; c) detection of the vertical second derivative of velocities that are larger than 7 times the standard deviation of the 20 surrounding profiles; d) final visual identification of outliers over groups of 20 profiles. For each outlier detection b), c), d) manual data removal was done only when judged necessary, depending on location, depth and surrounding currents.
SADCP database is in matlab format:
- data file (4.6Mb)
- Format: variable name sadcp is a structure. For cruise ic sadcp(ic) contains (nd is the number of depth bin, specific to each cruise)
- name : cruise name
- n: number of profiles
- lat (1:n)
- lon (1:n)
- u (1:nd, 1:n)
- v (1:nd, 1:n)
- z (1:nd) : depth
- date (1:n)
- meta: no used
- acknowledgement: reference
- weblink: web site address
Optimal interpolation
- Gridded SADCP data over 20-100m and 100-300m: LEGOS web site
Supplementary Figures
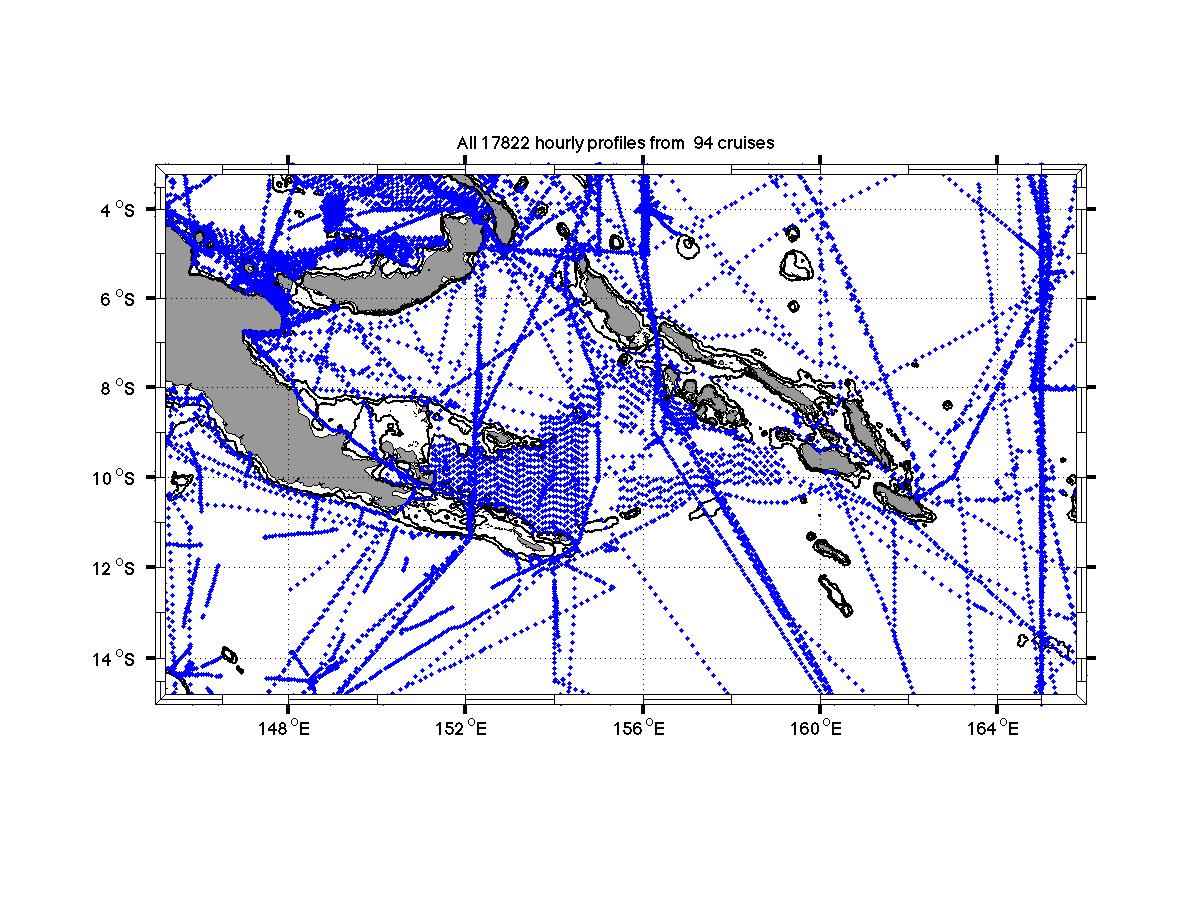
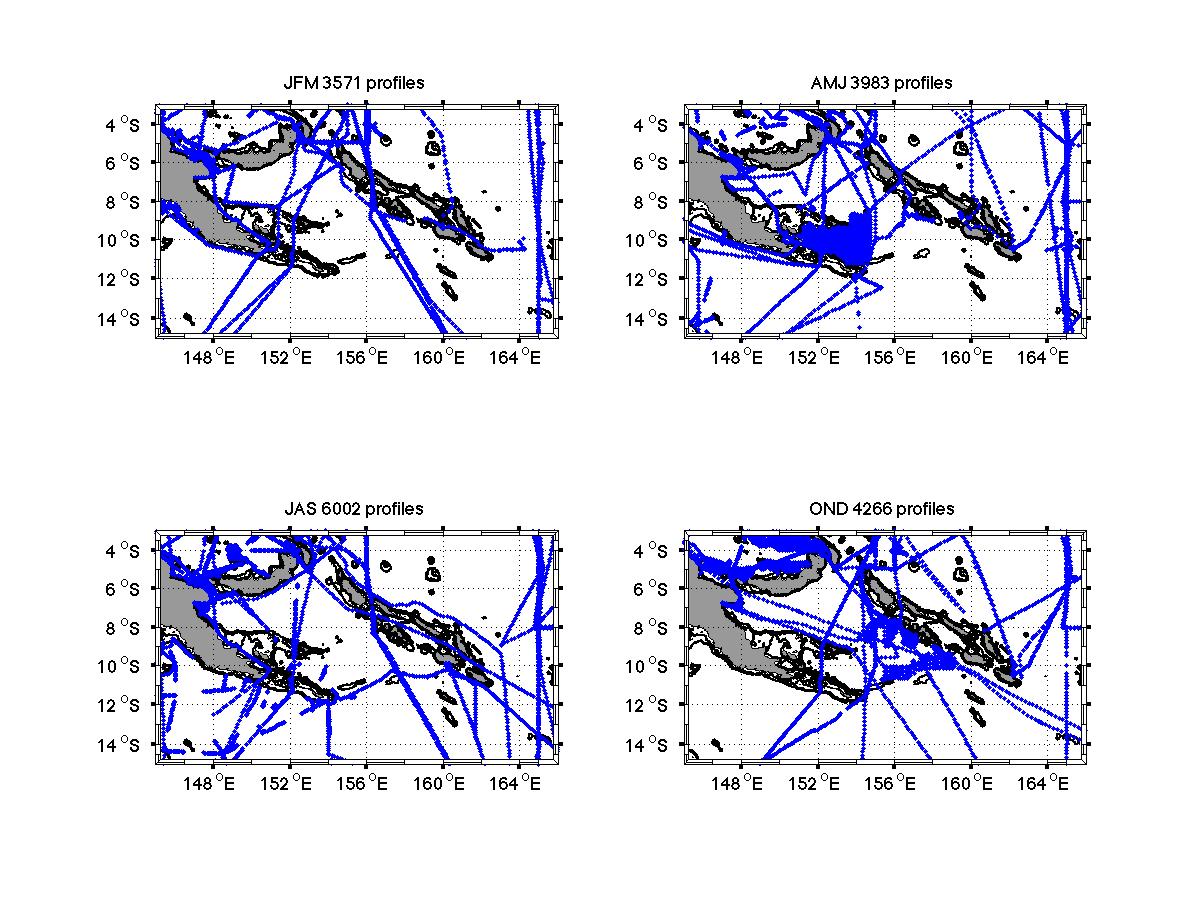
SADCP data distribution
- Map with location of all profiles
- Map with seasonal profile distribution
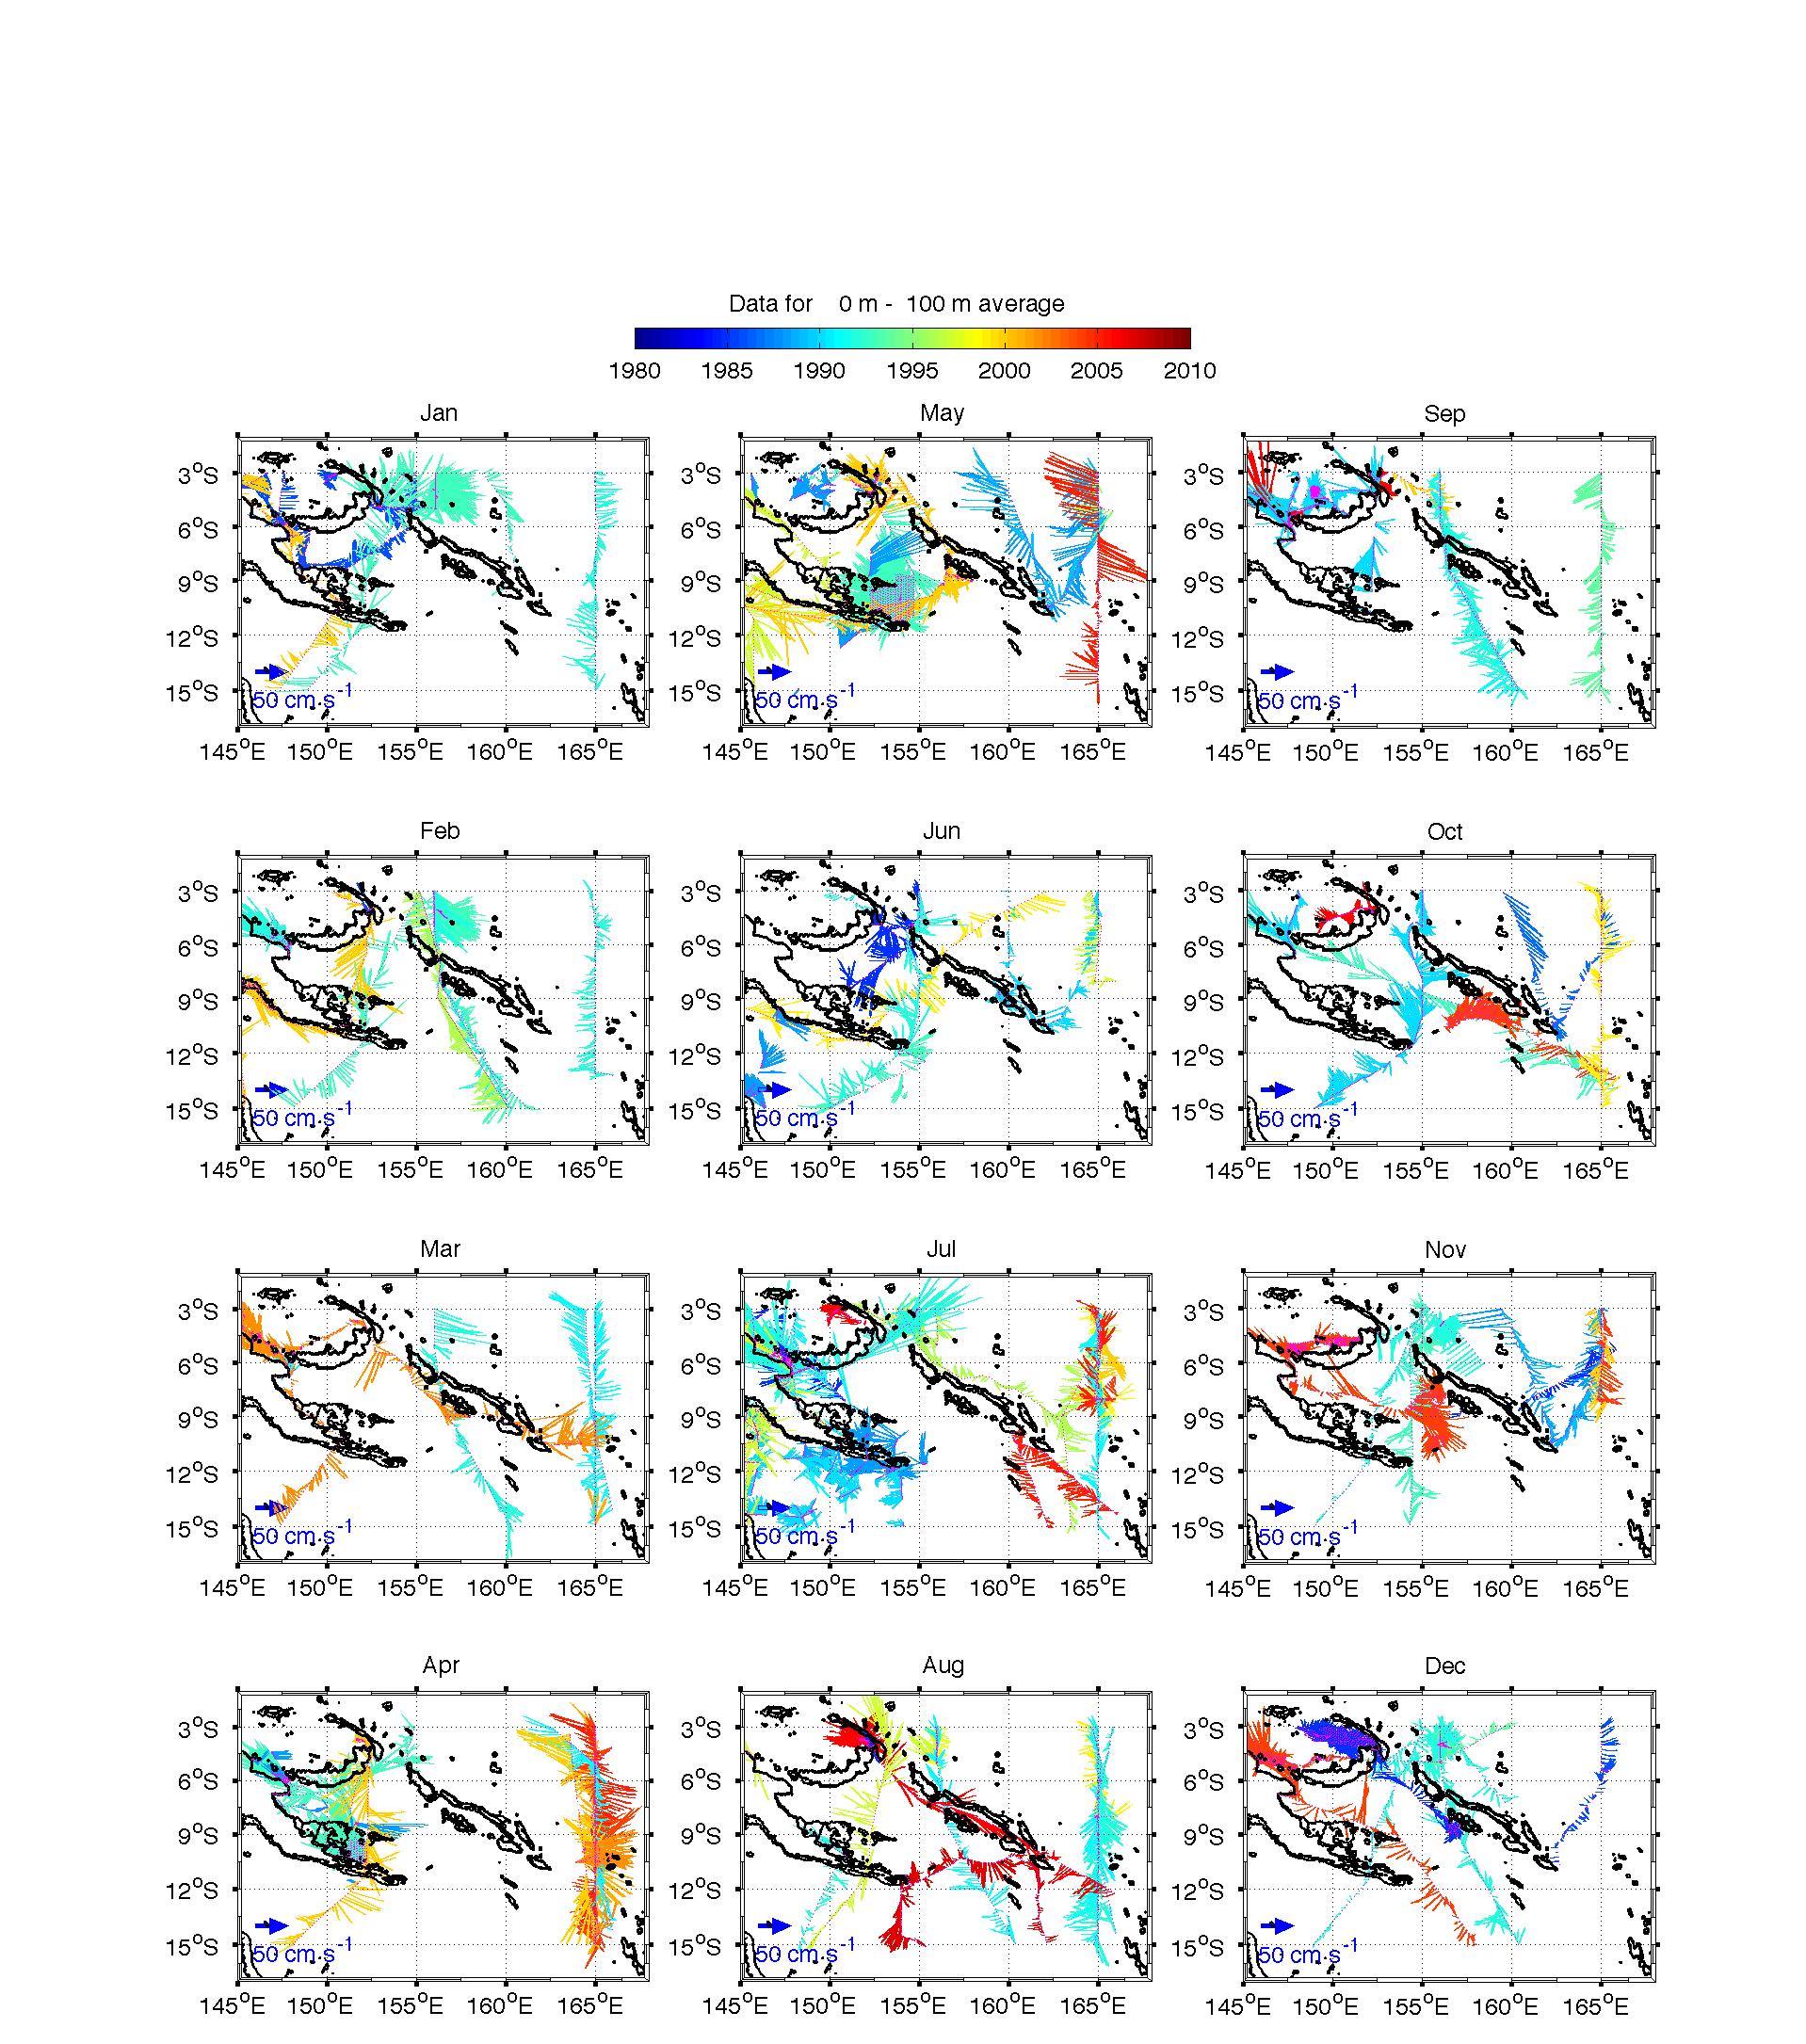
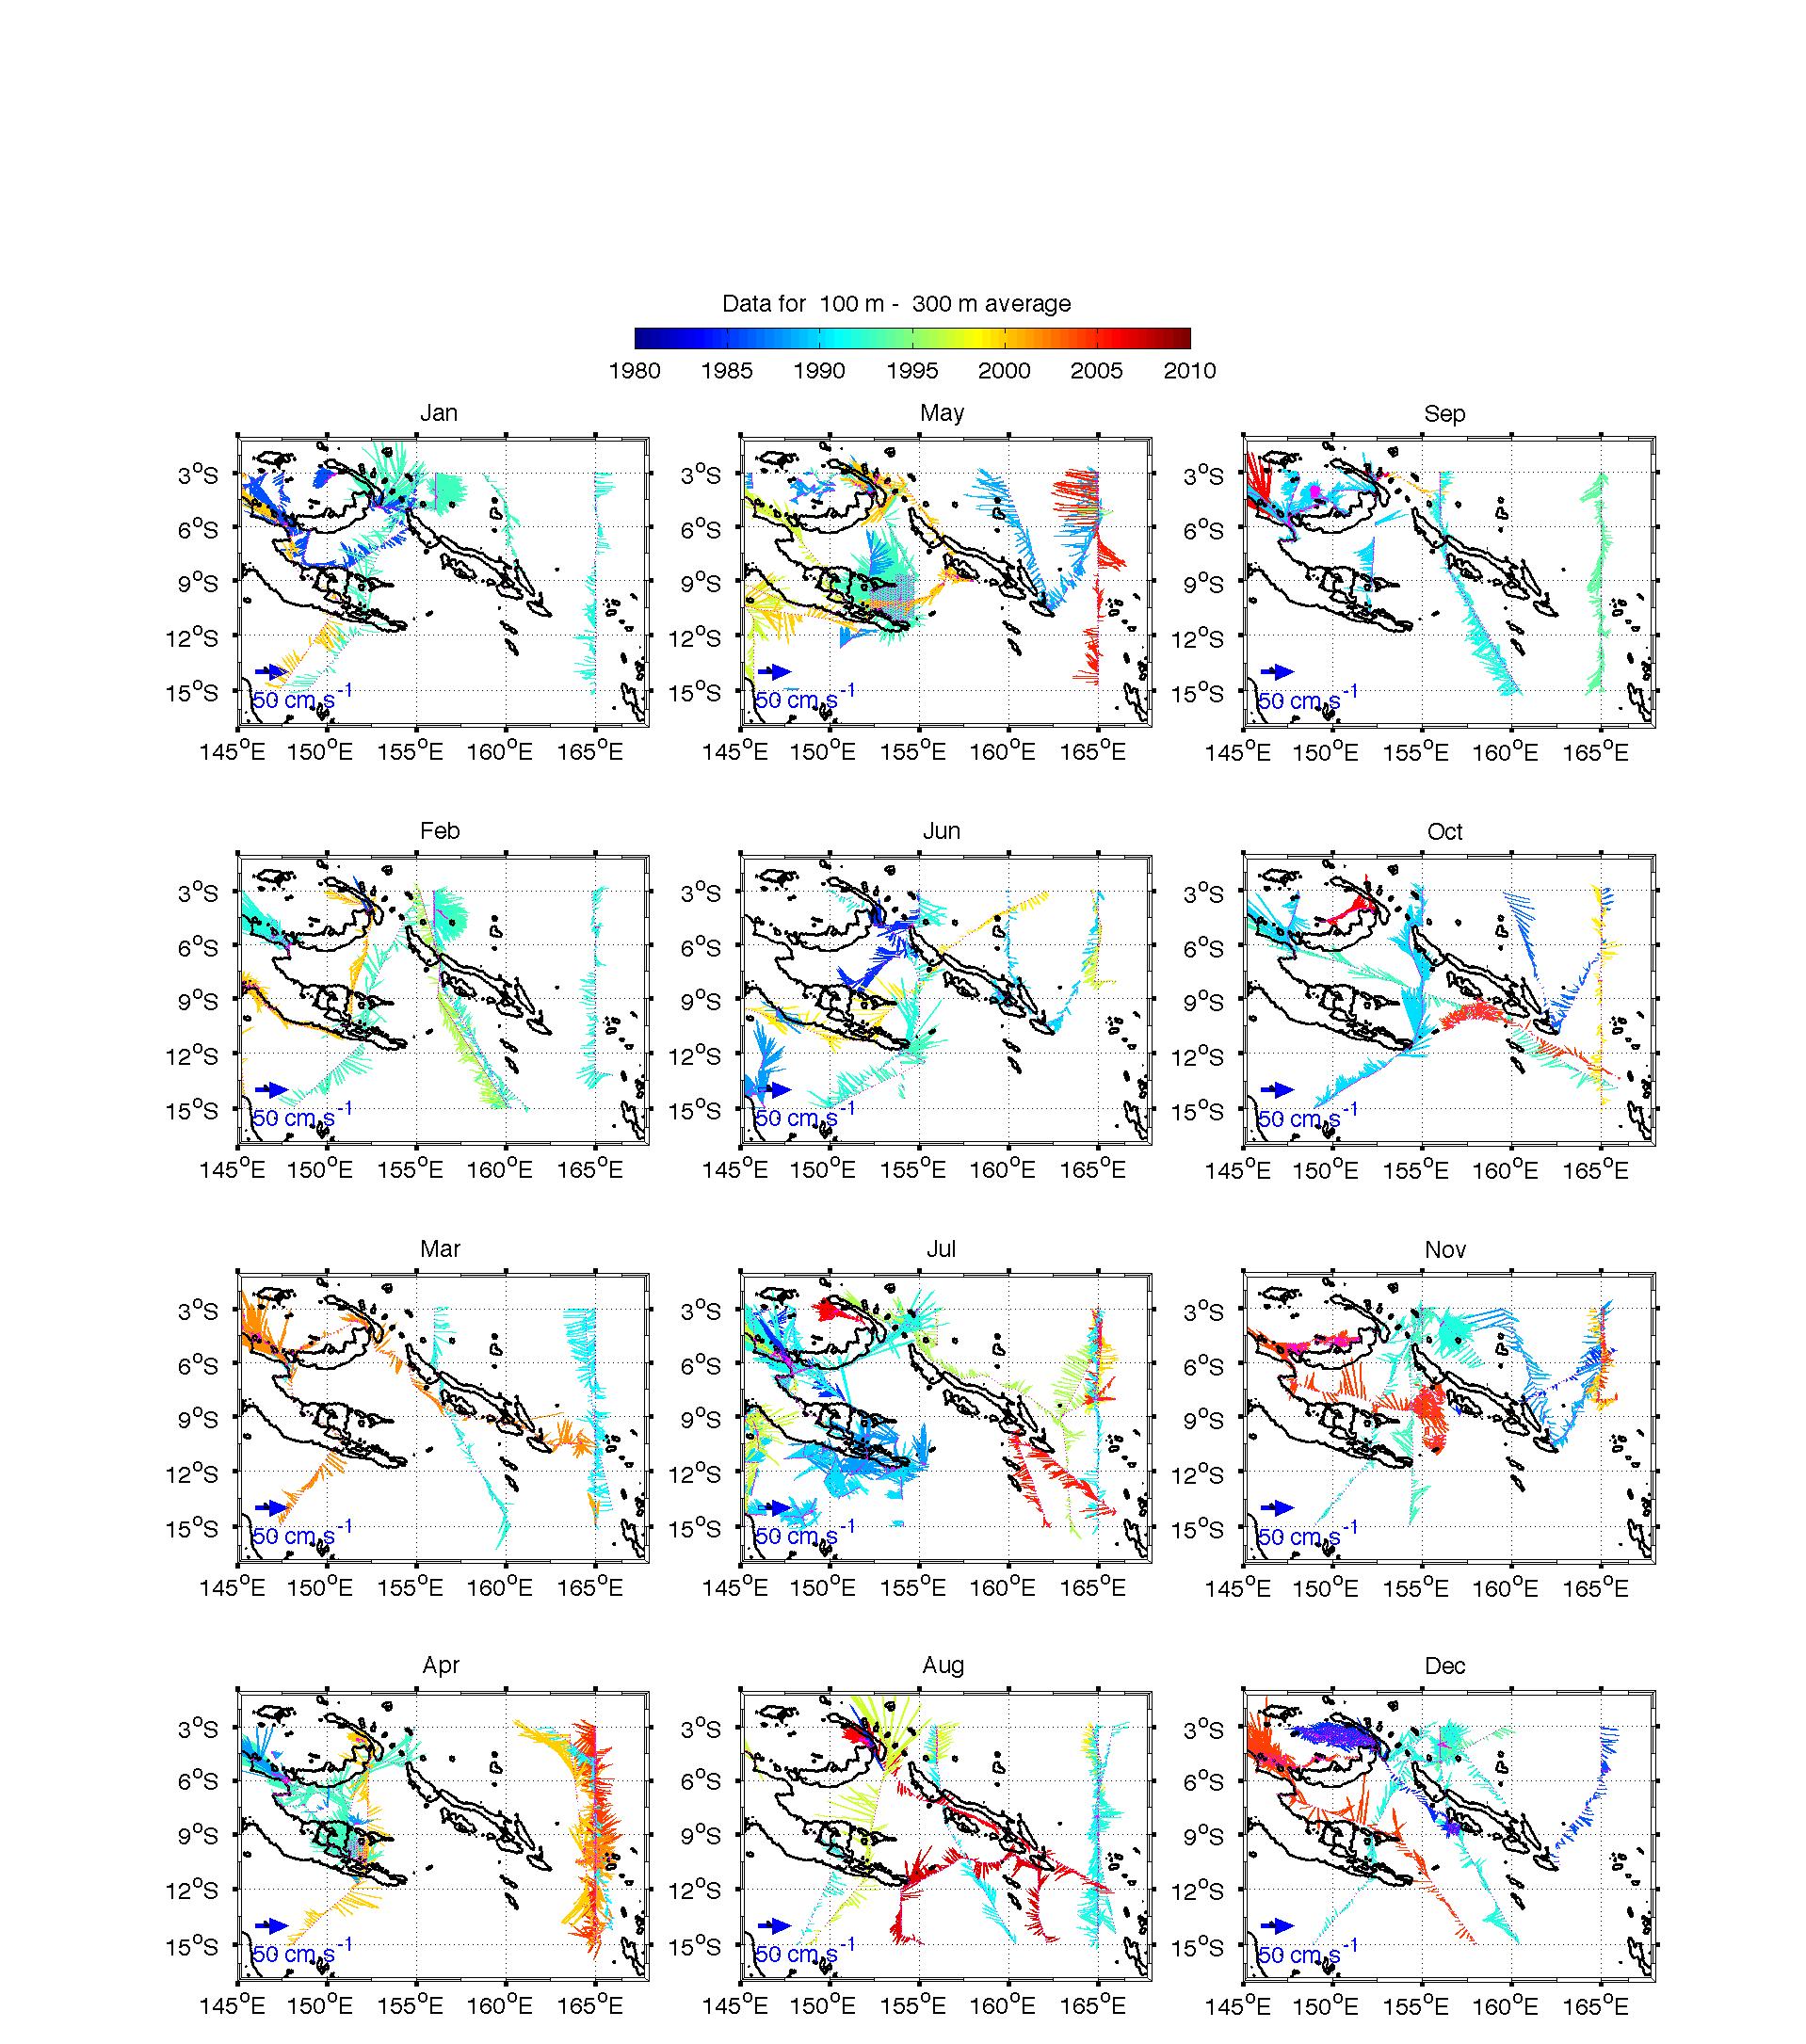
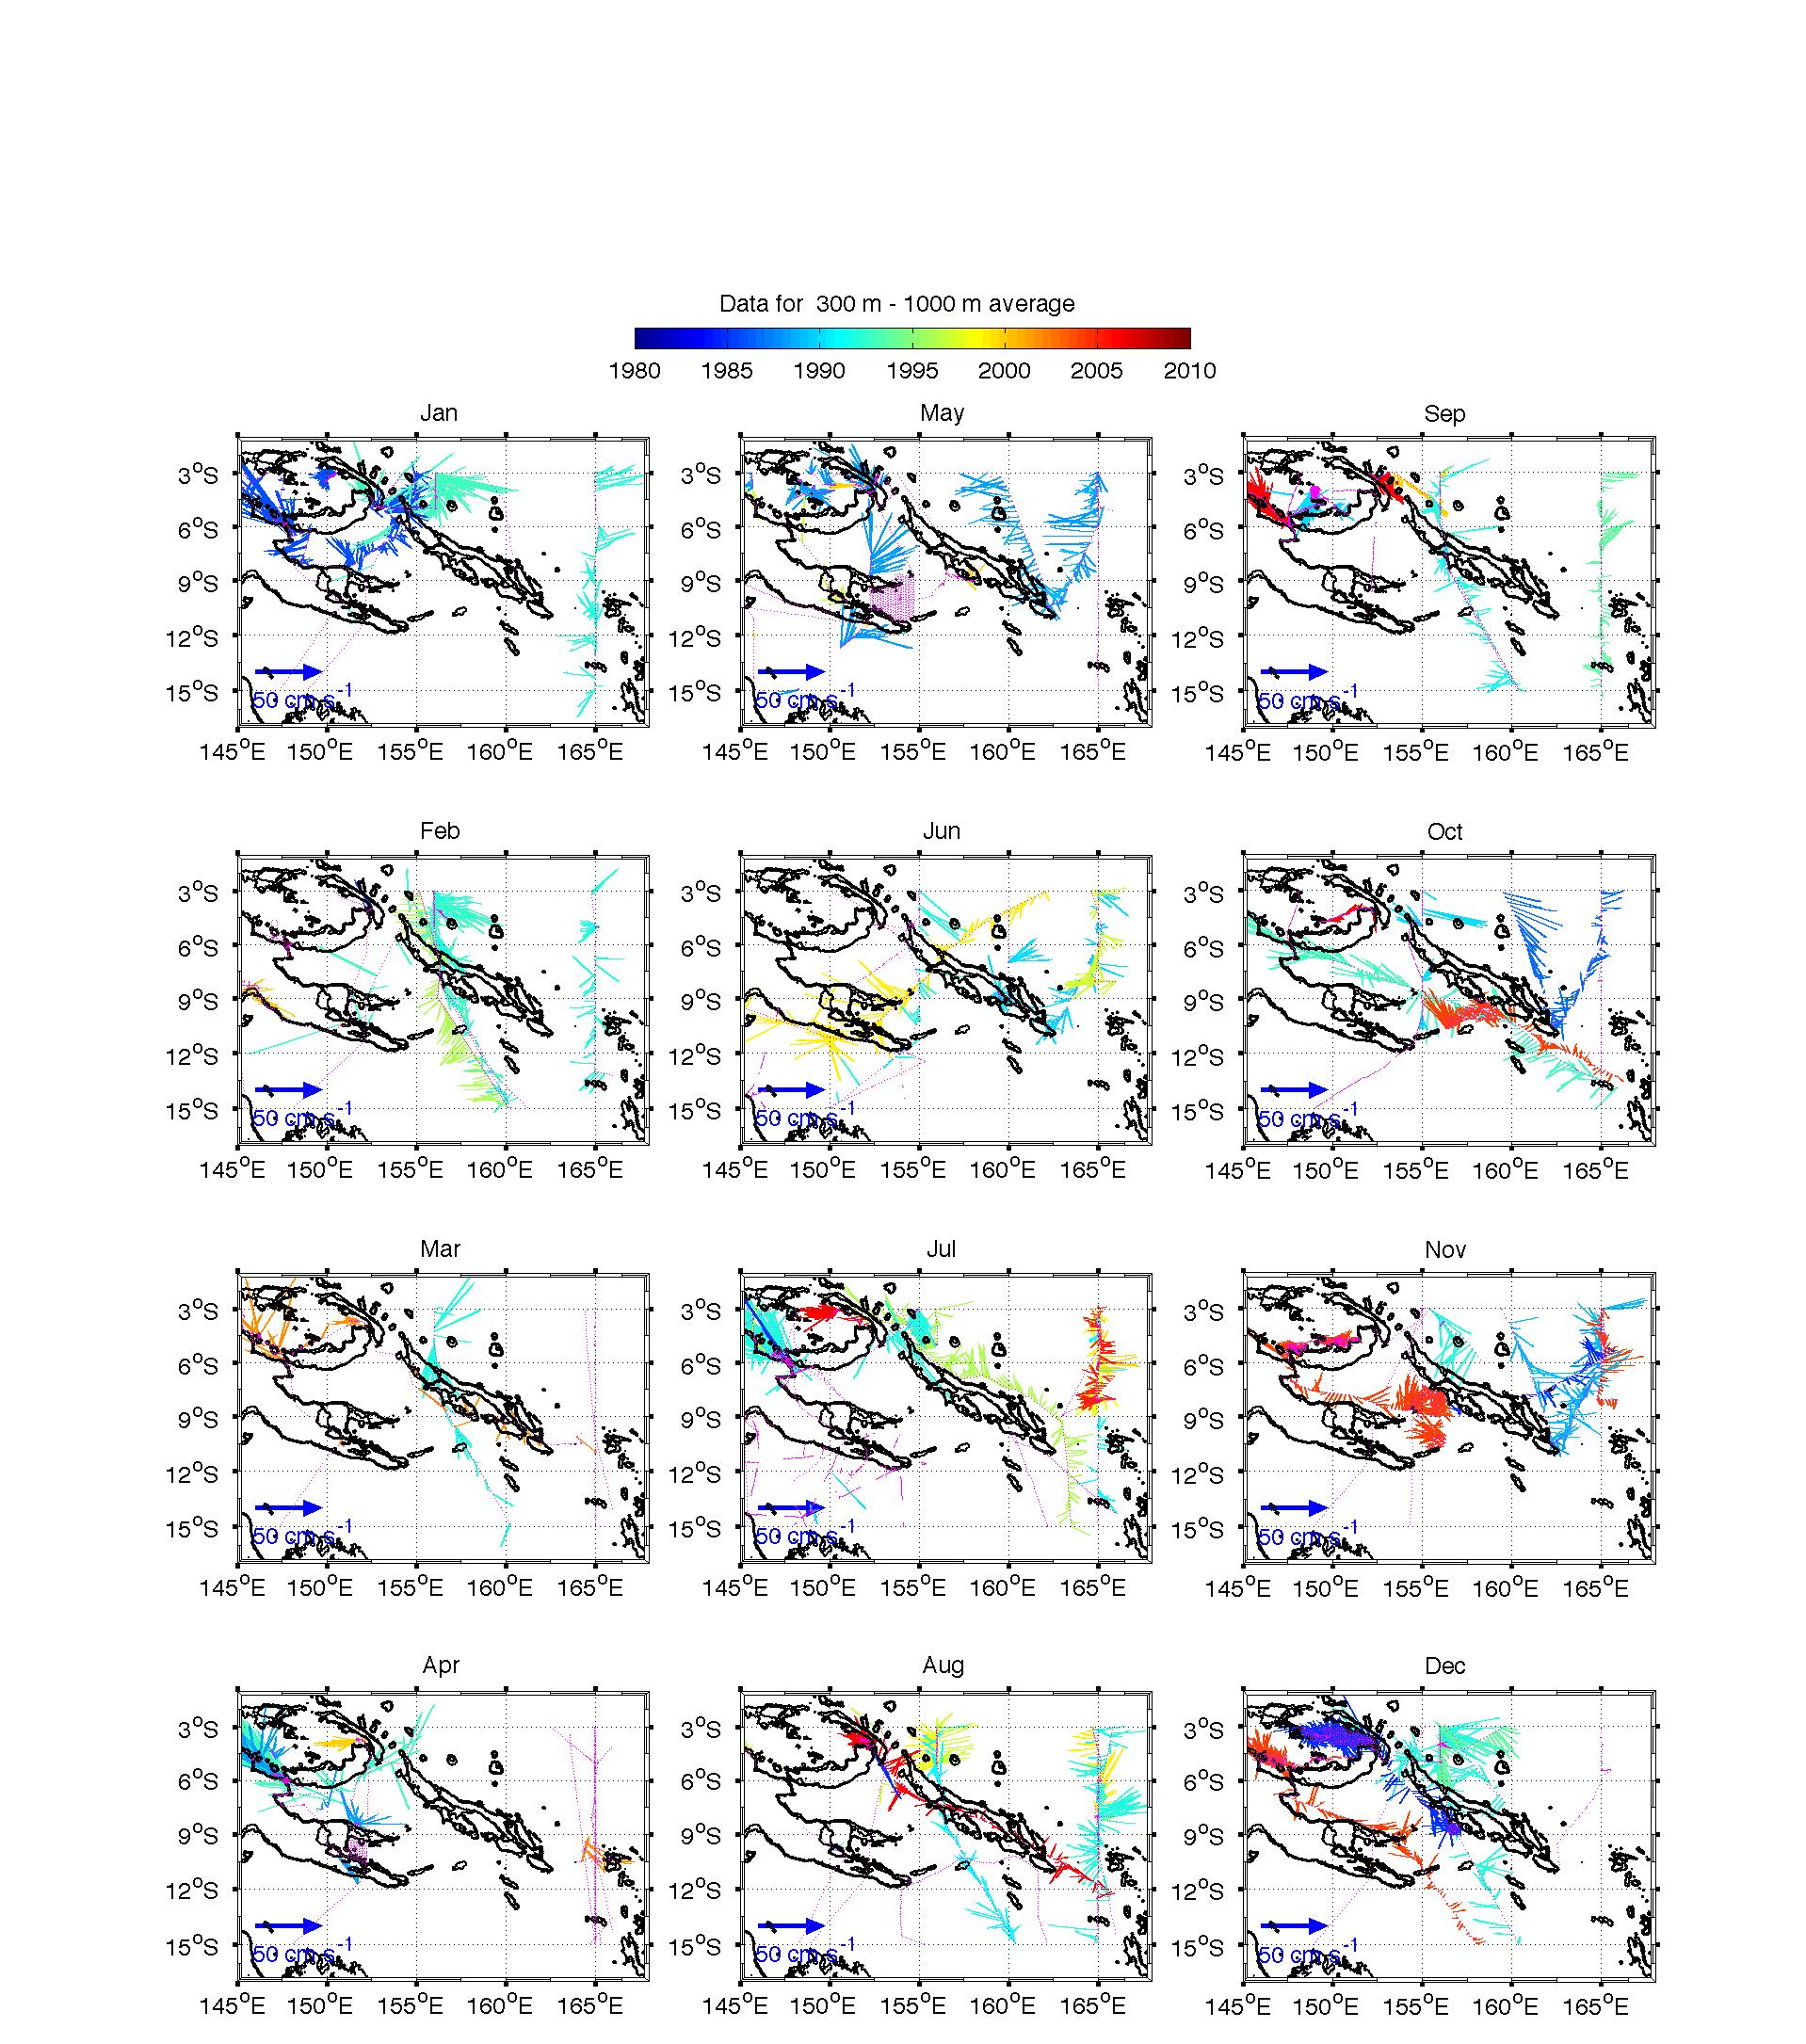
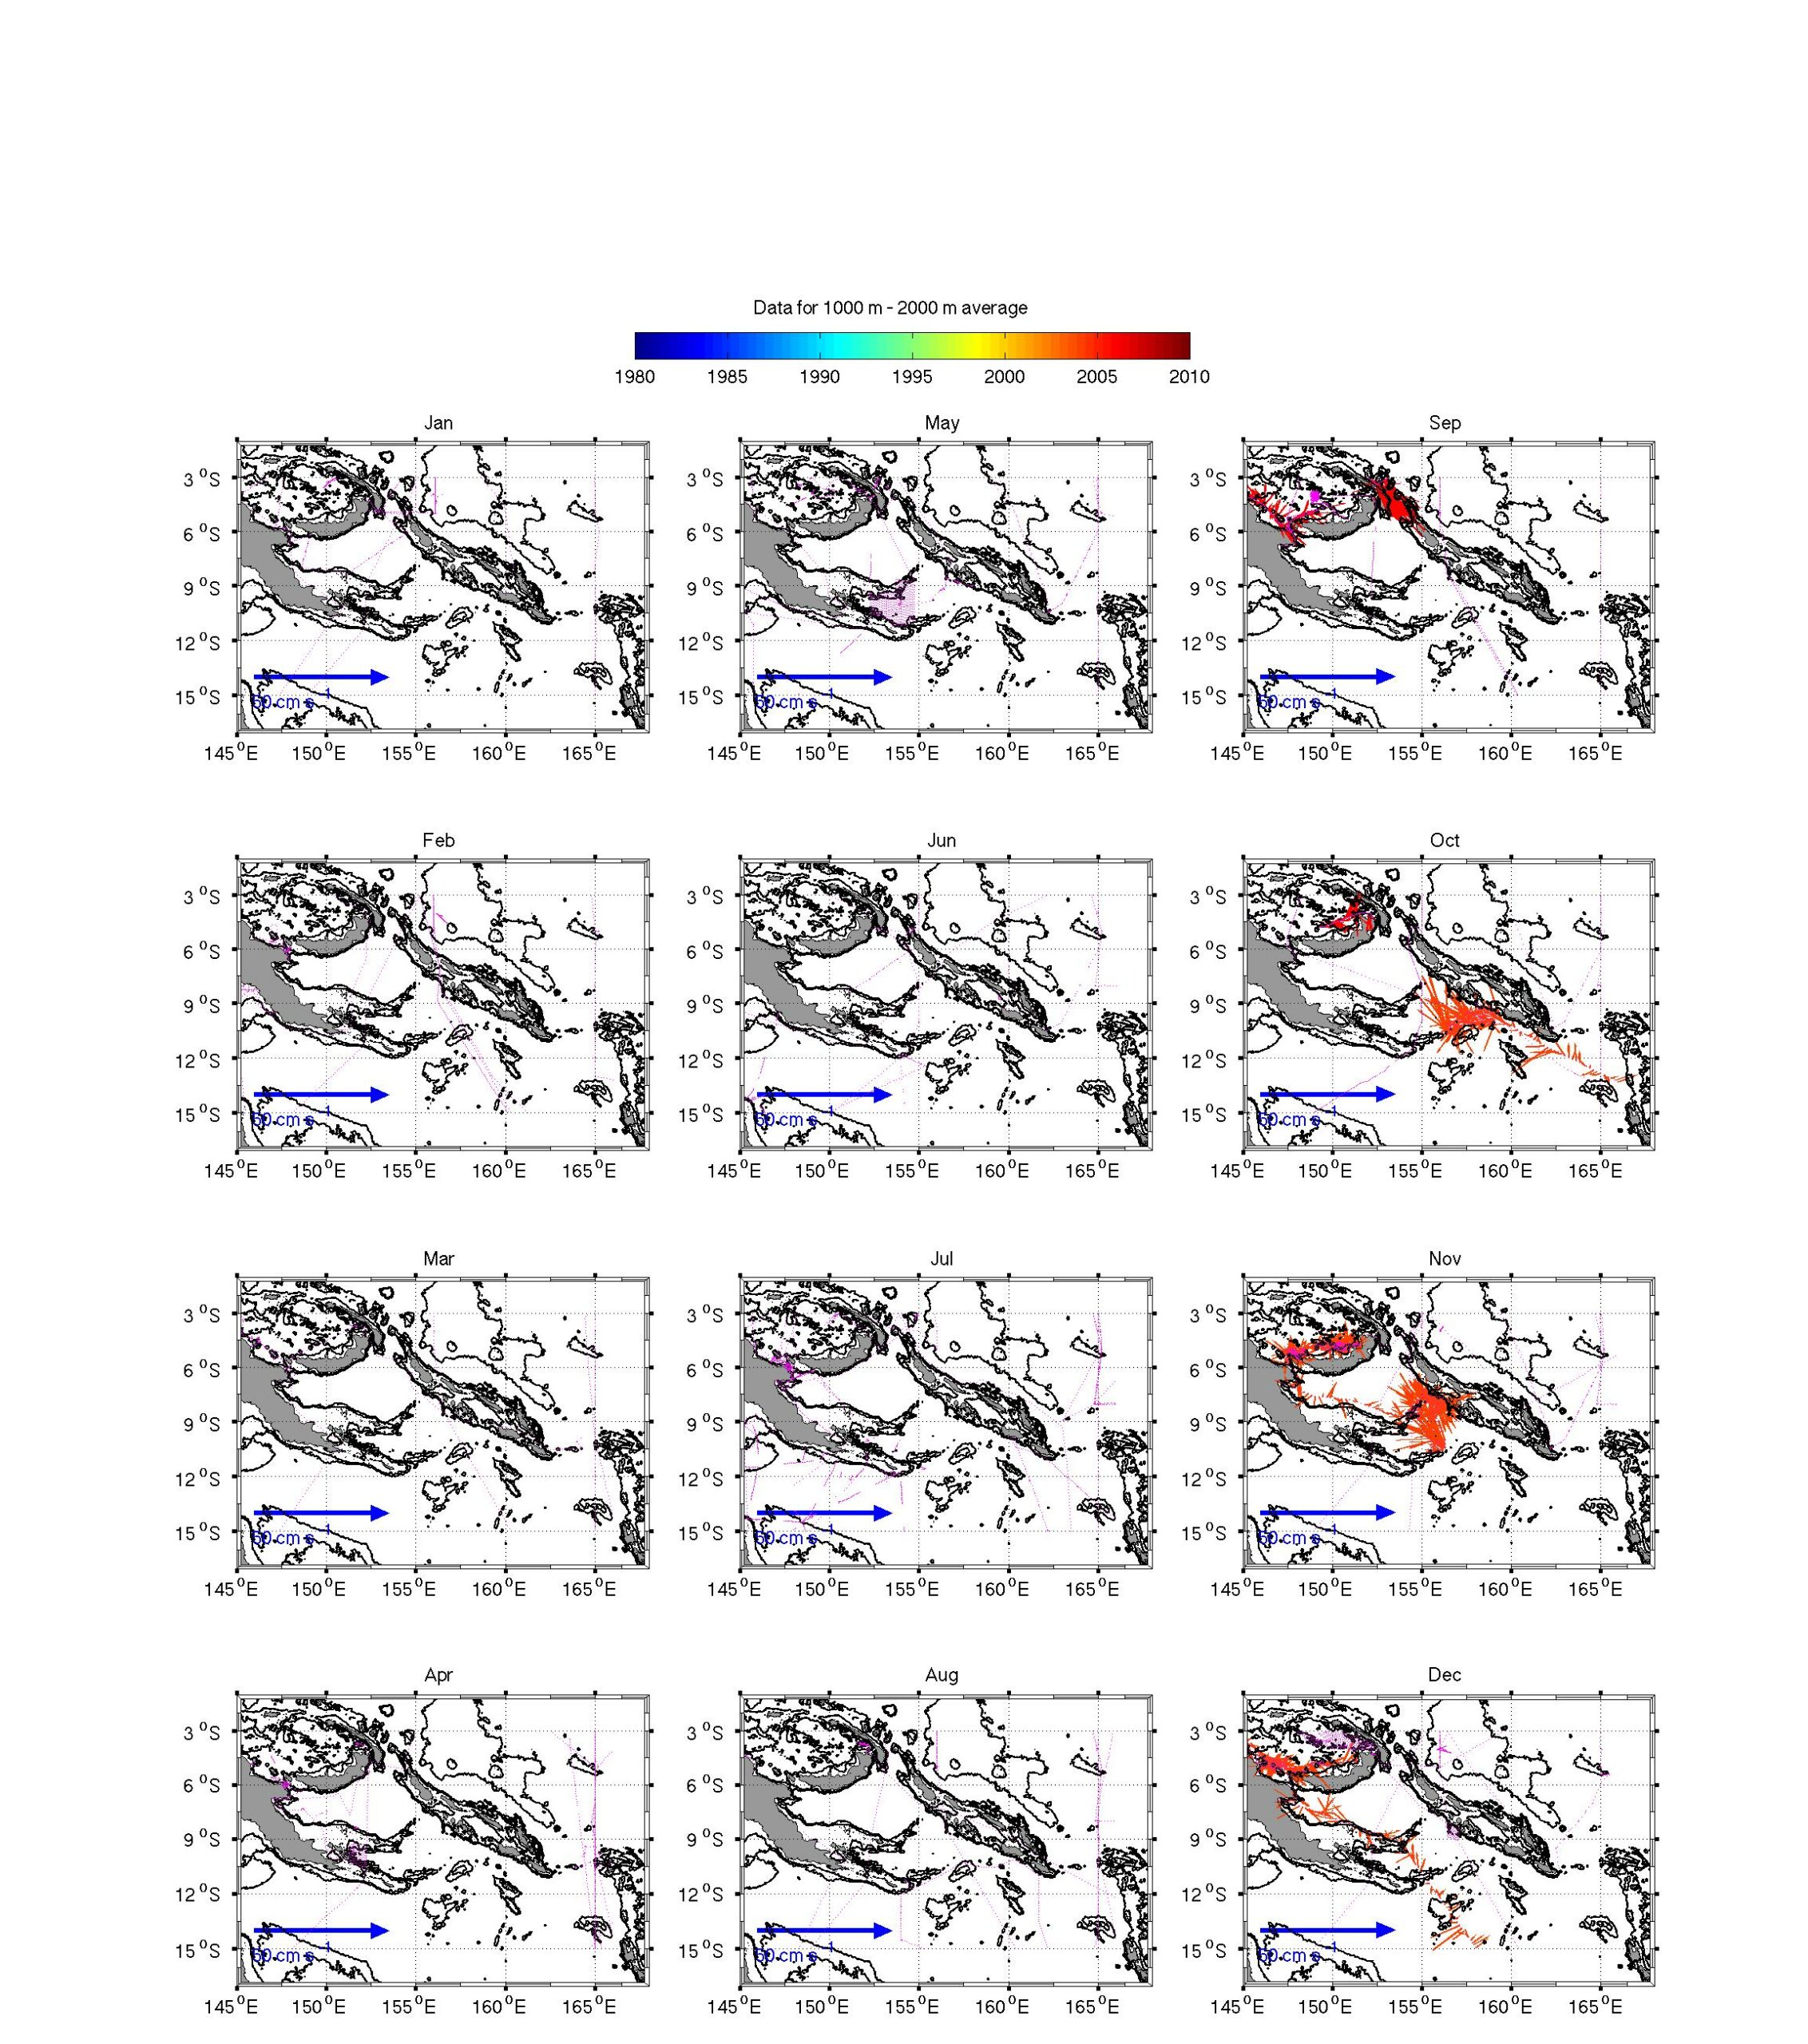
- Monthly maps of depth-averaged velocities: 0-100m, 100-300m, 300-1000m, 1000m-2000m
OI graphics
See Cravatte et al. 2011 for details
- Seasonal surface variability (0-100 m)
- Ekman variability
- Difference: Vsurface (0-100 m)- V thermocline (100-300 m)
- CARS geostrophic (0-100 m) circulation (referenced to 1000 m)
Averaged sections
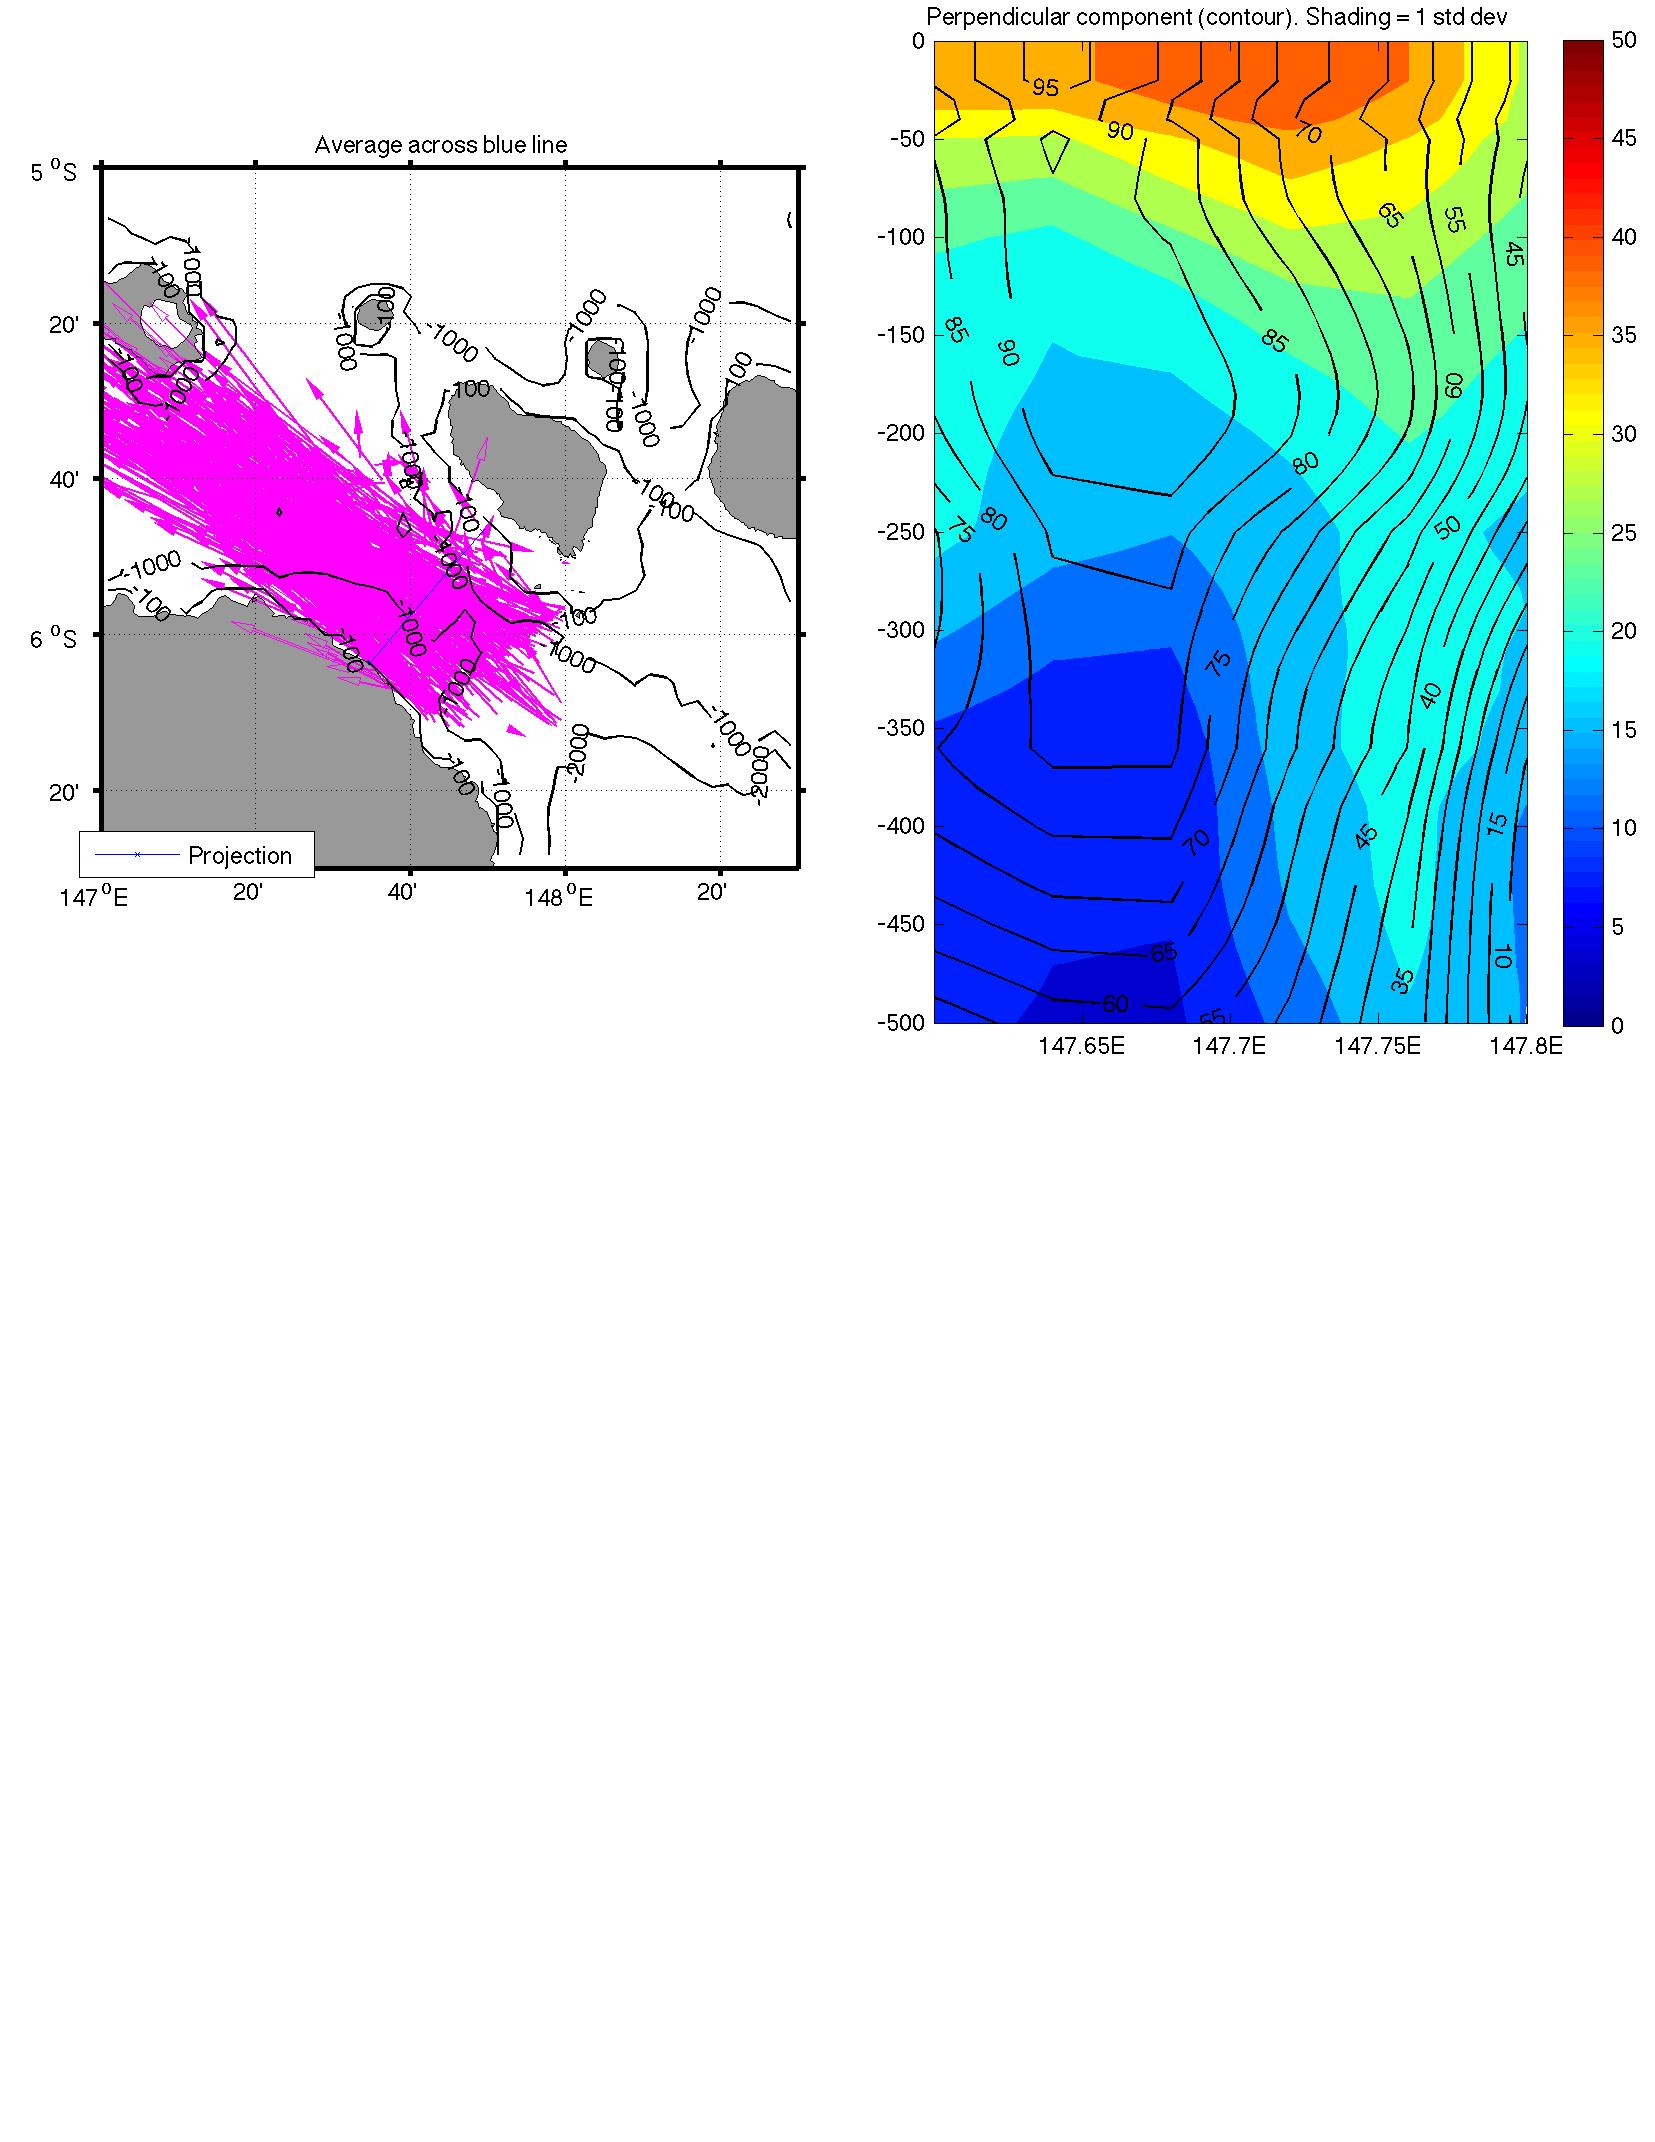
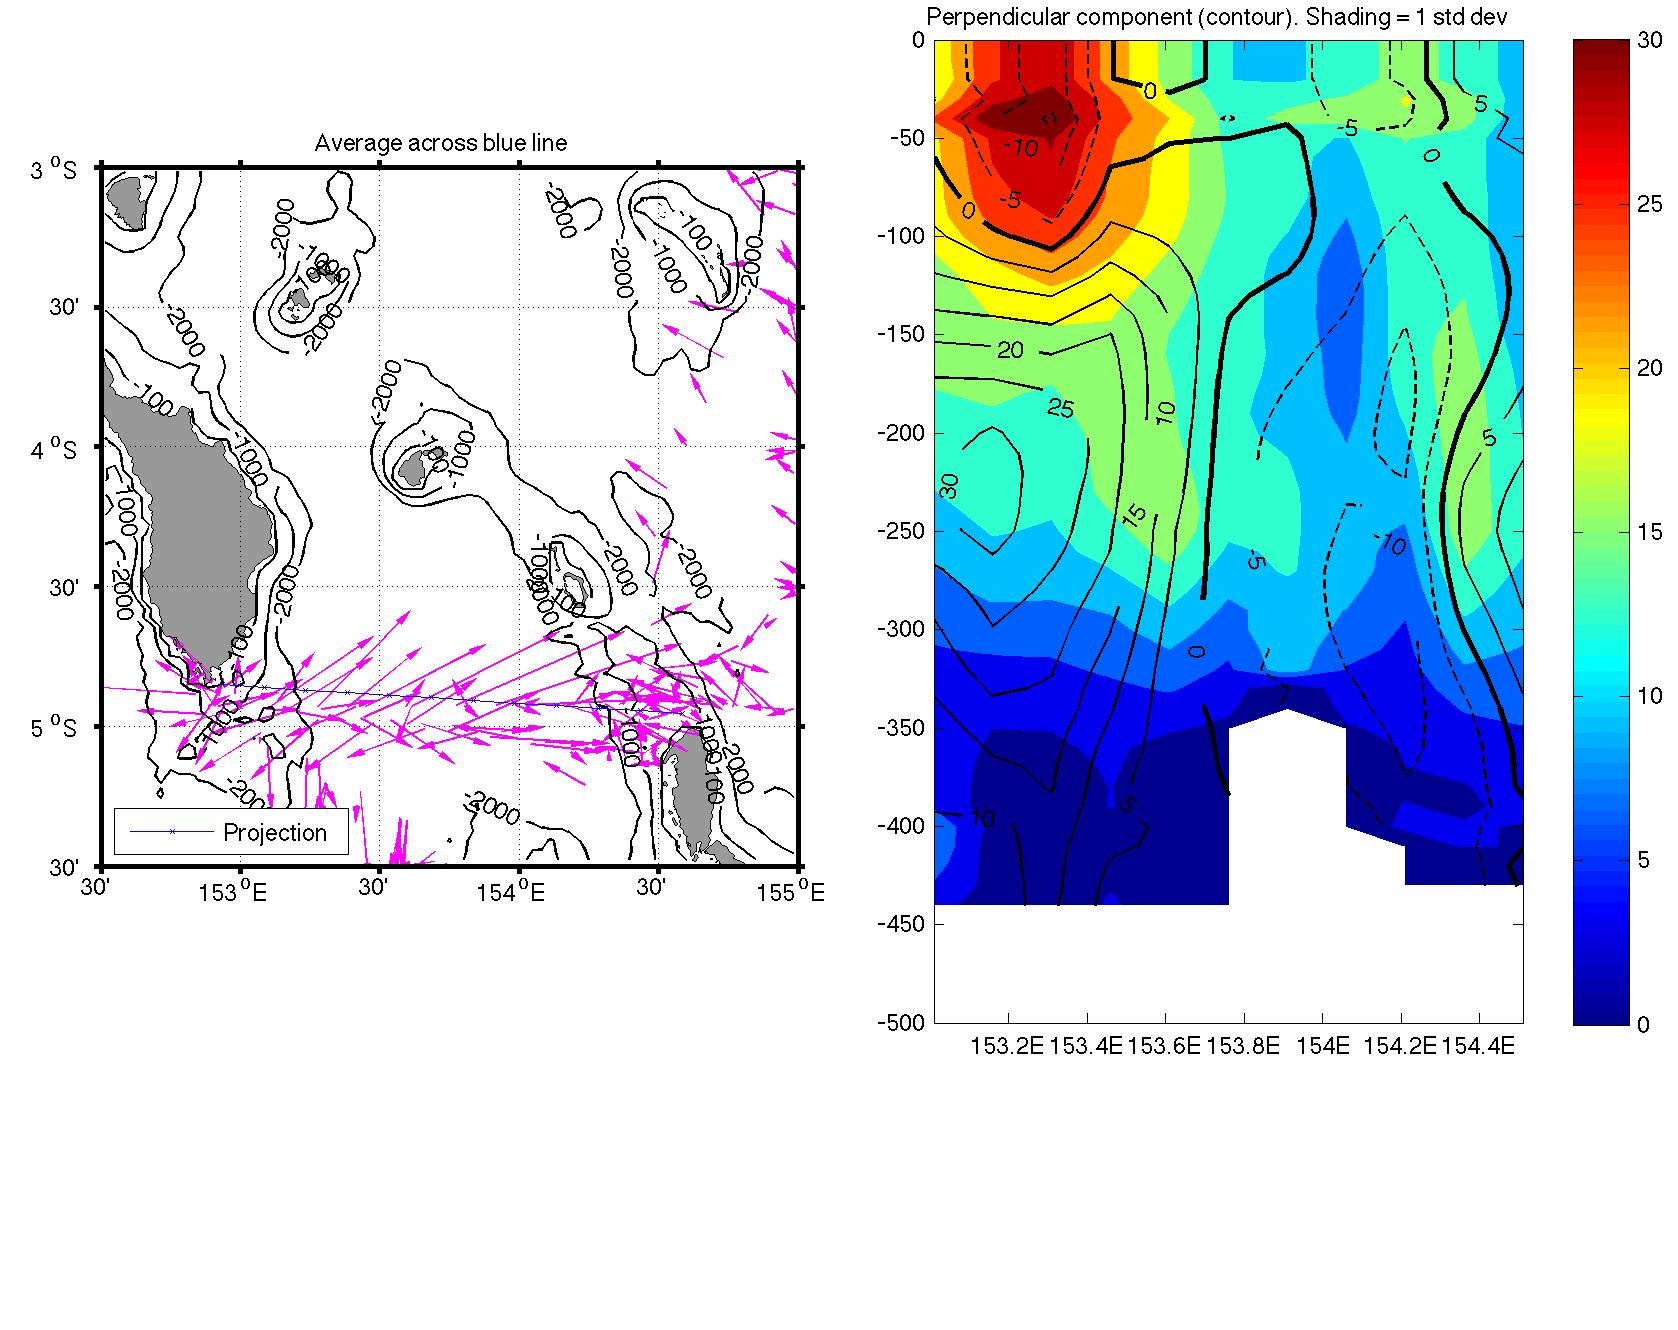
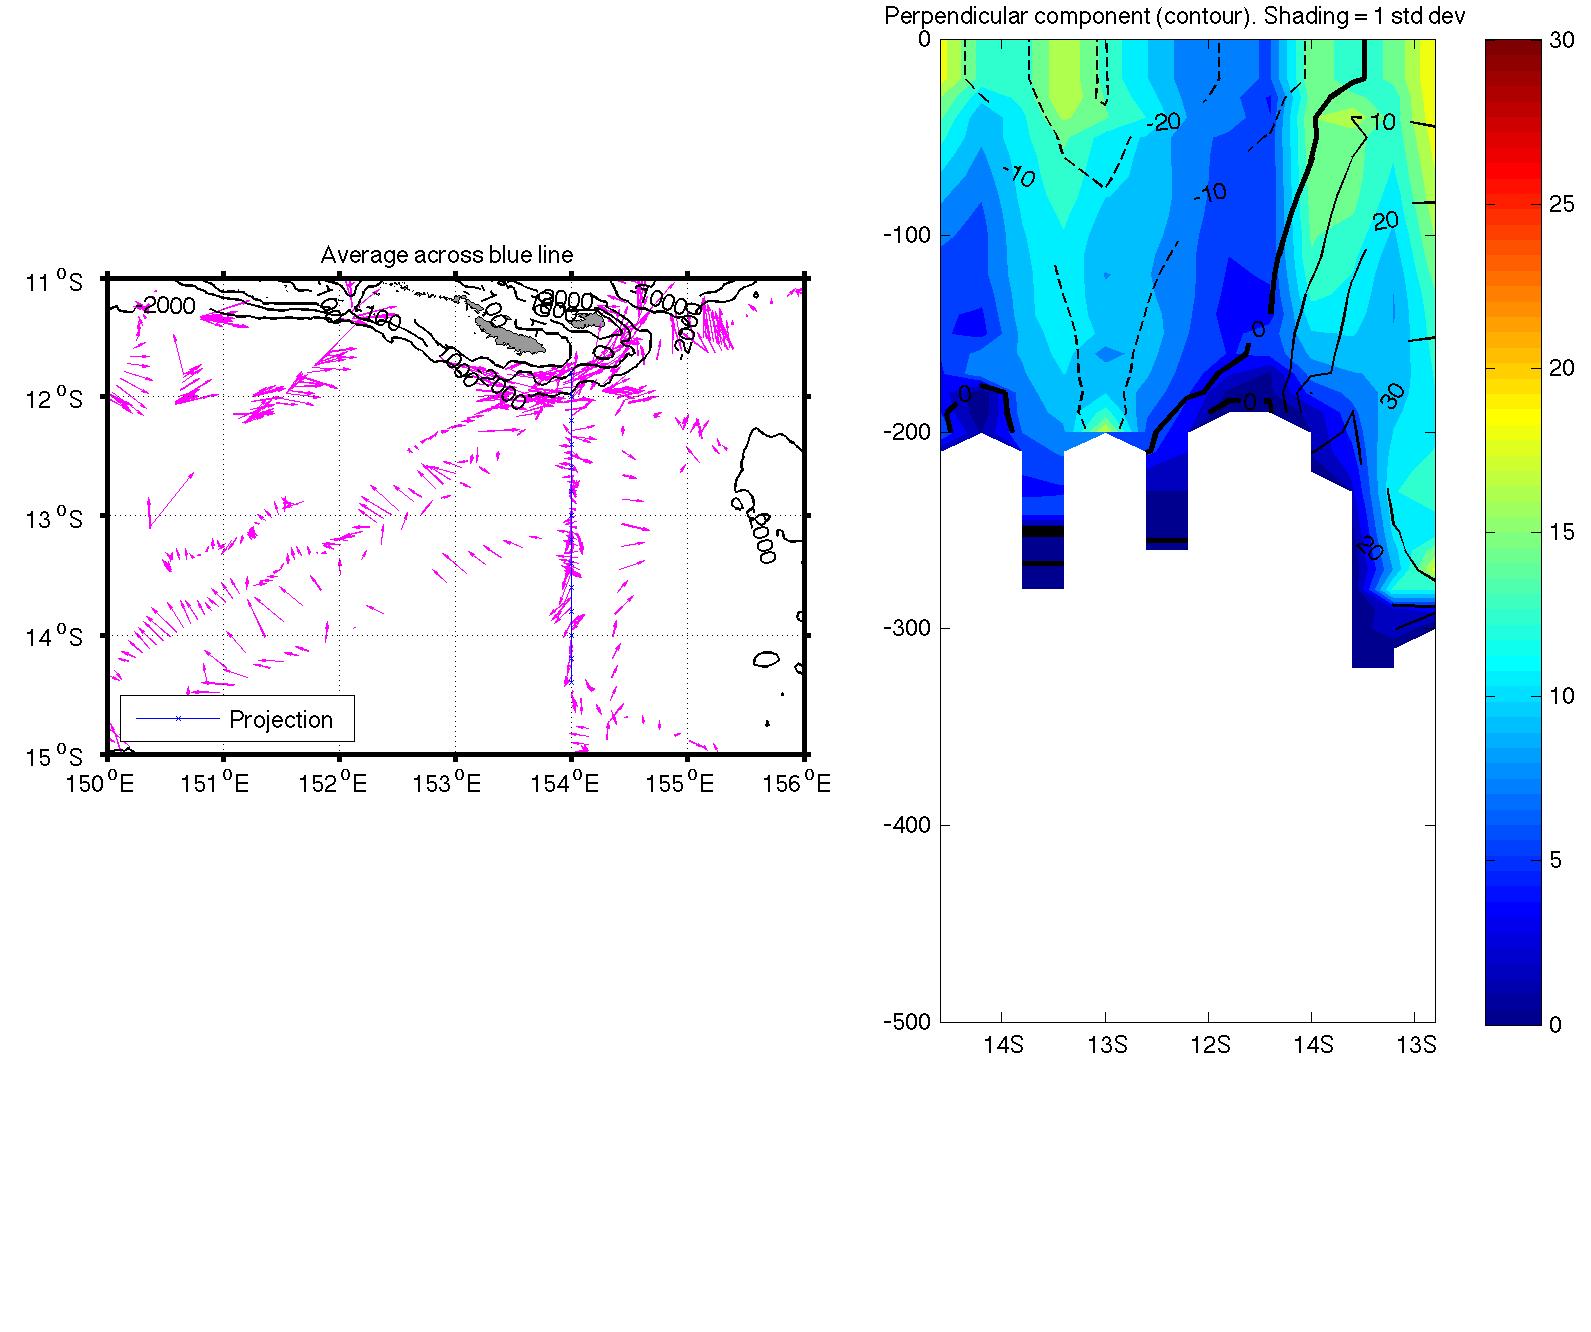
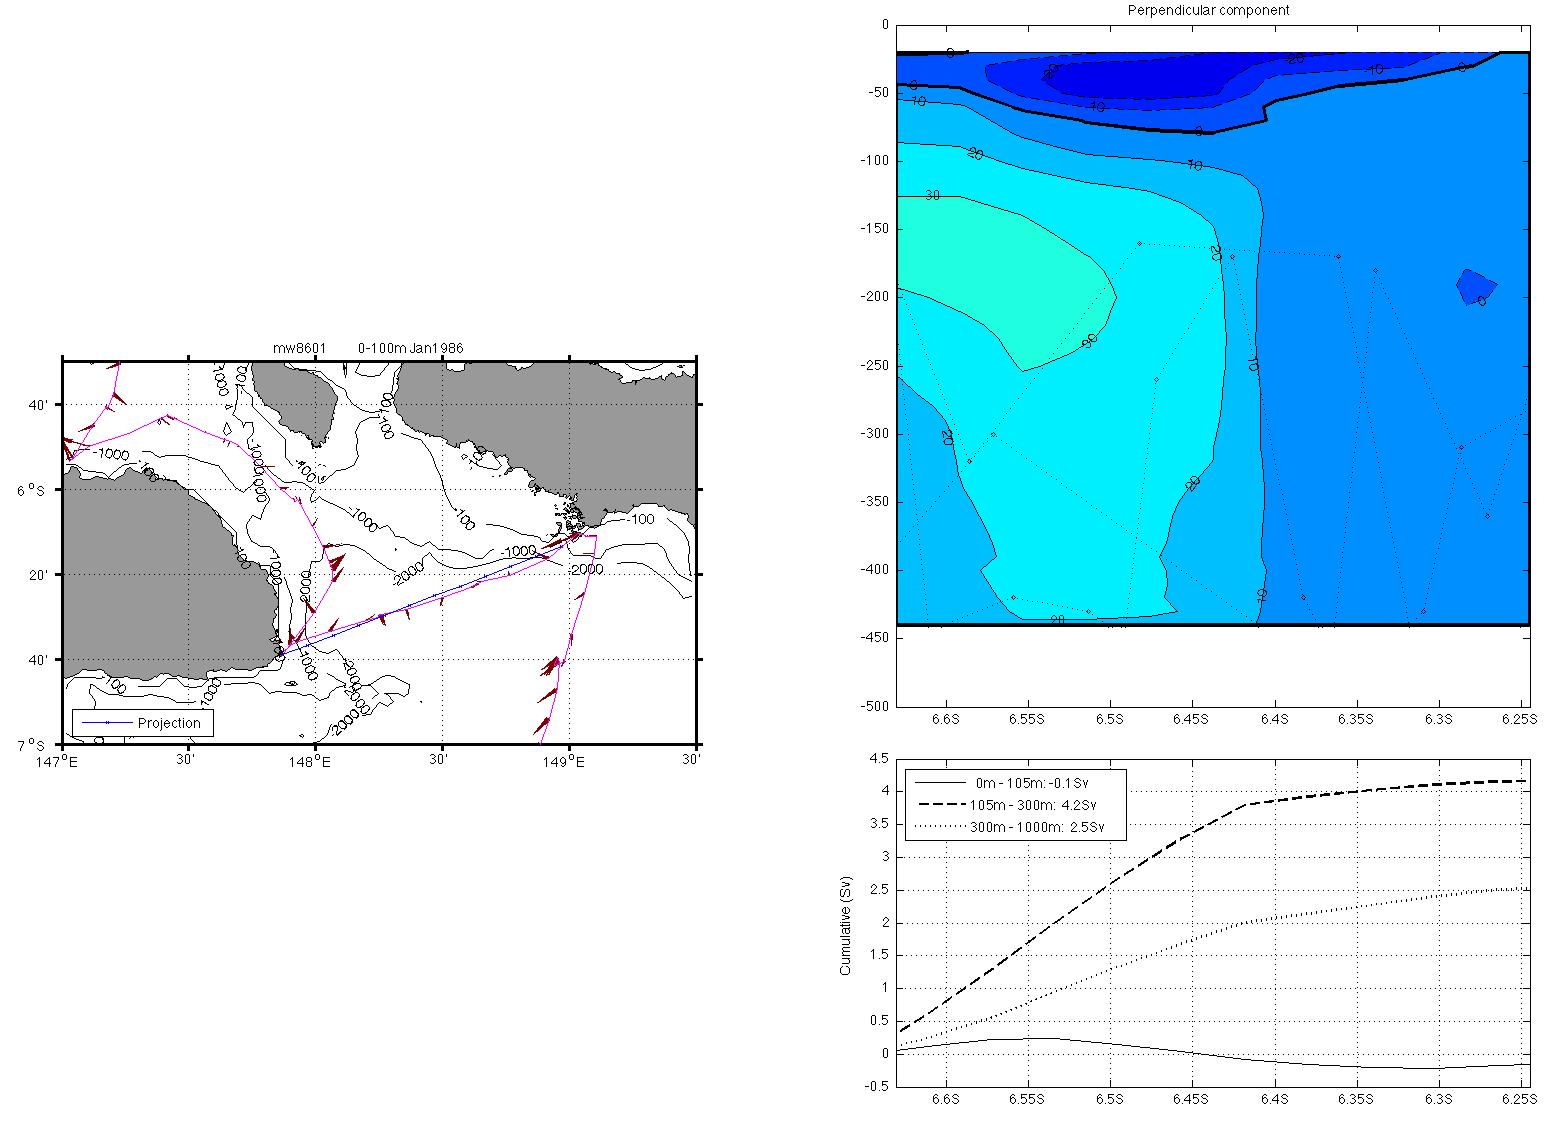
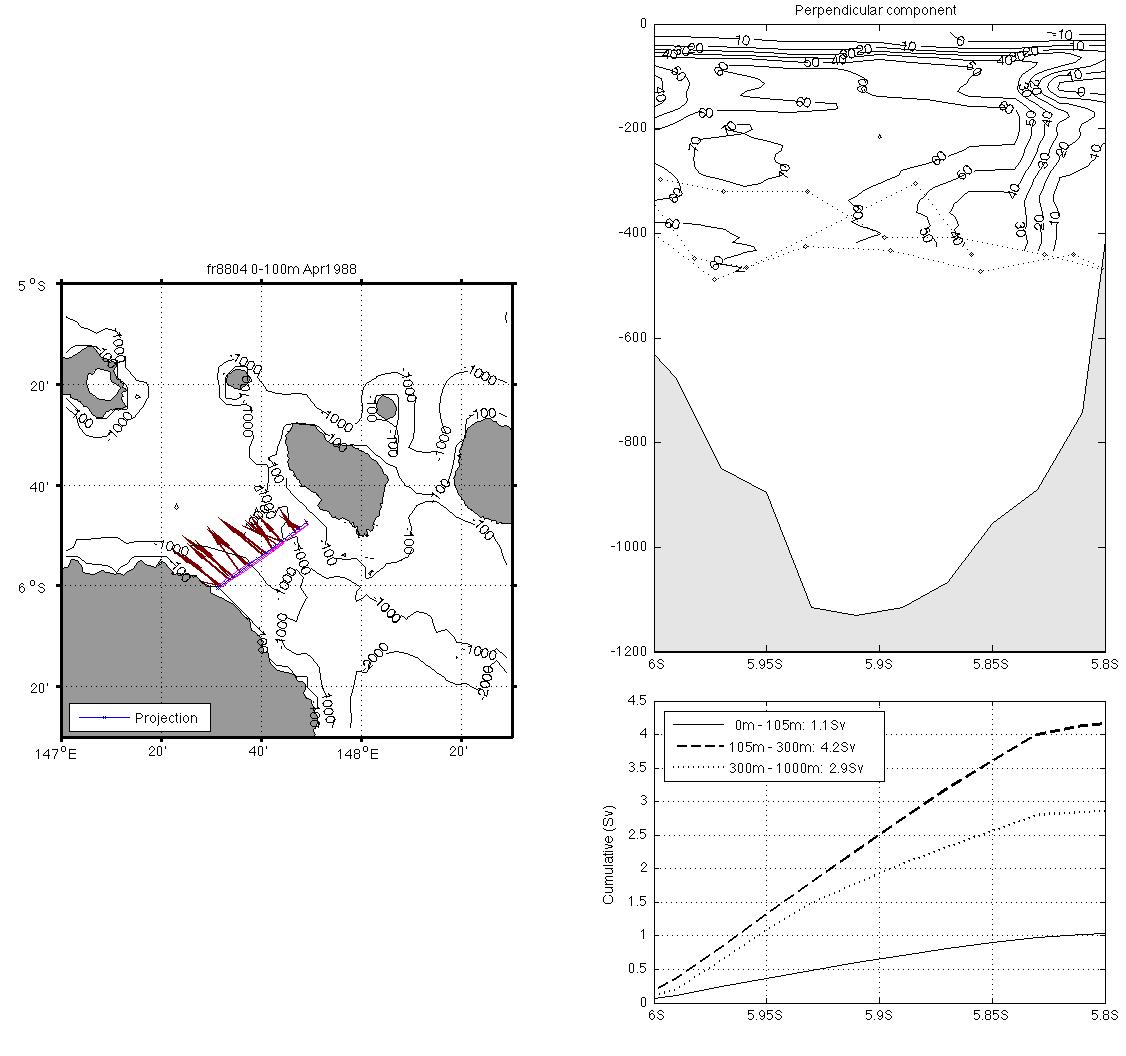
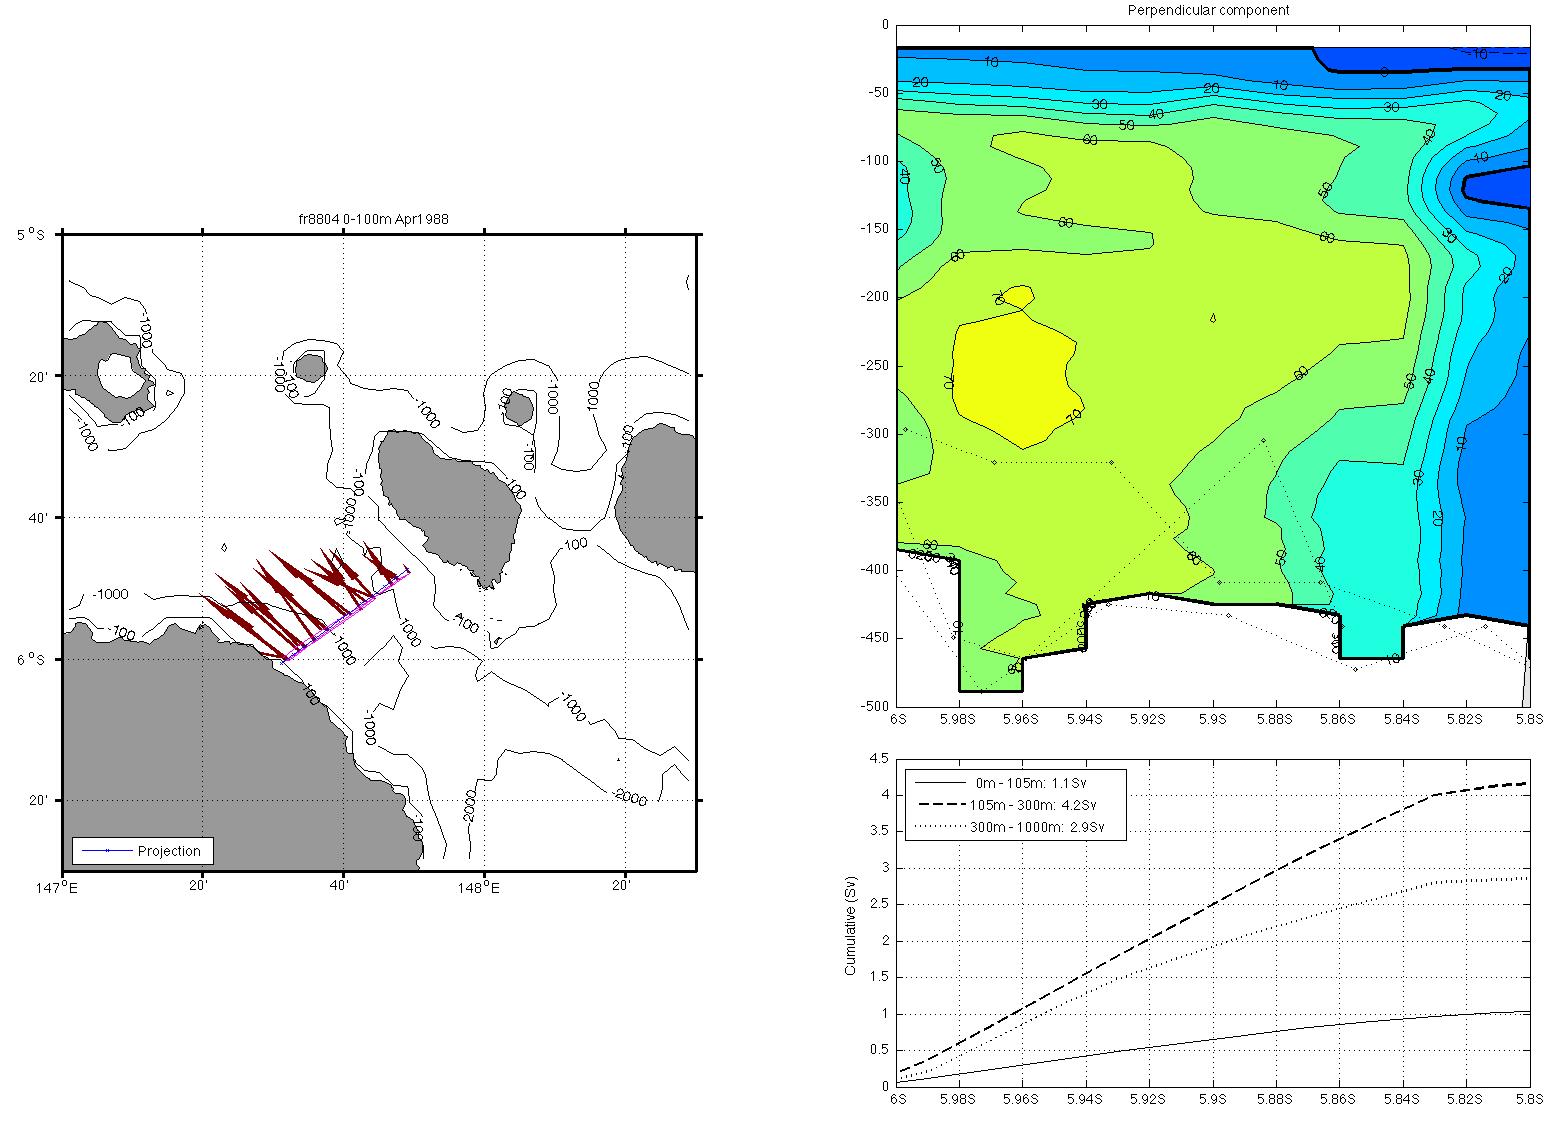
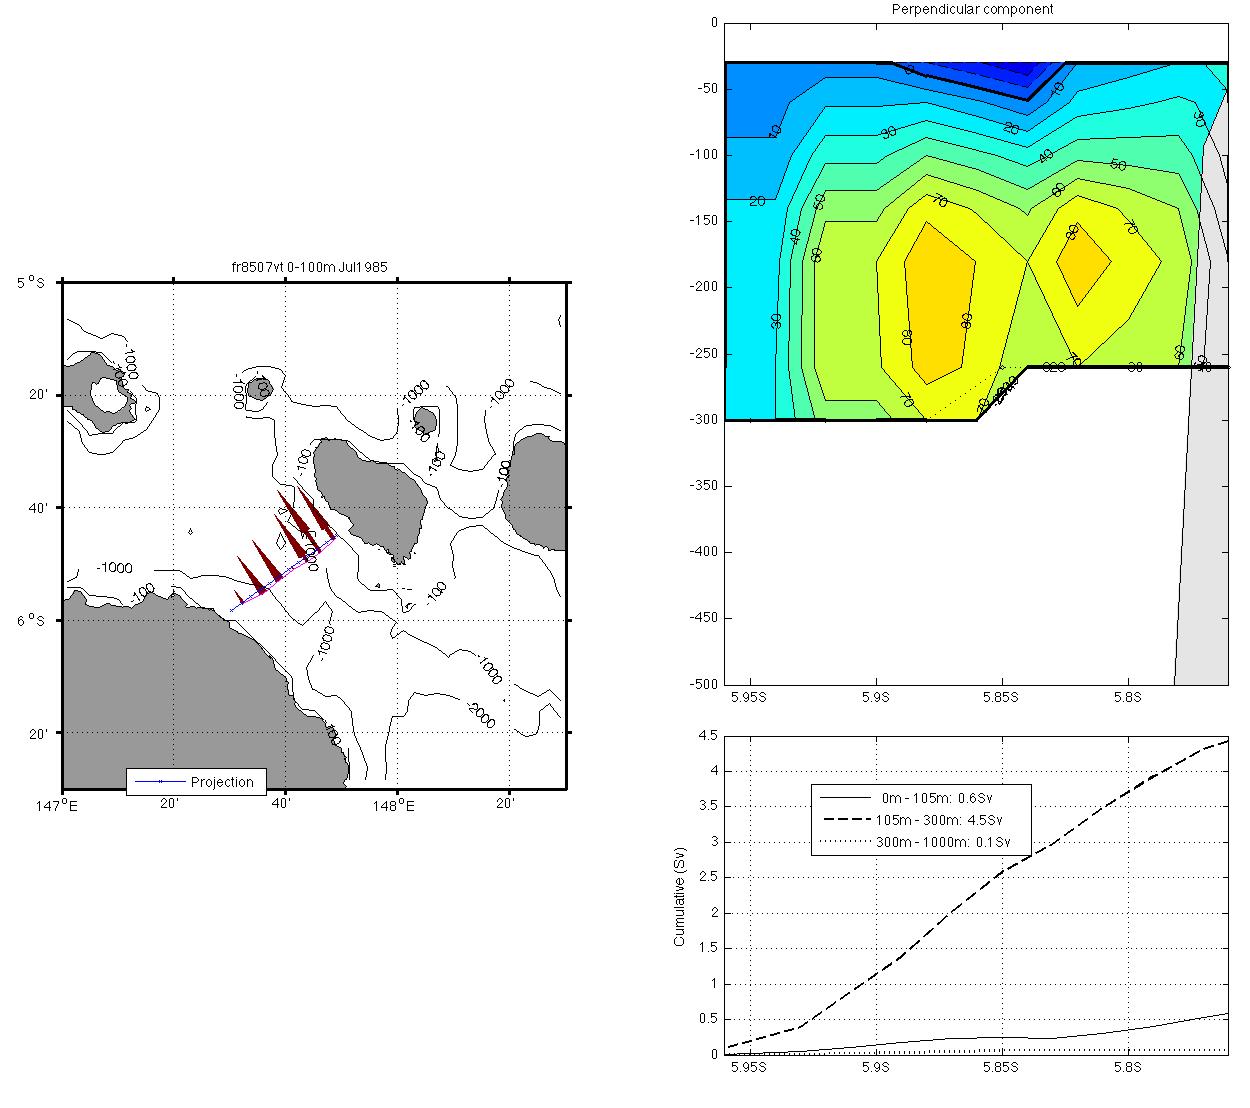
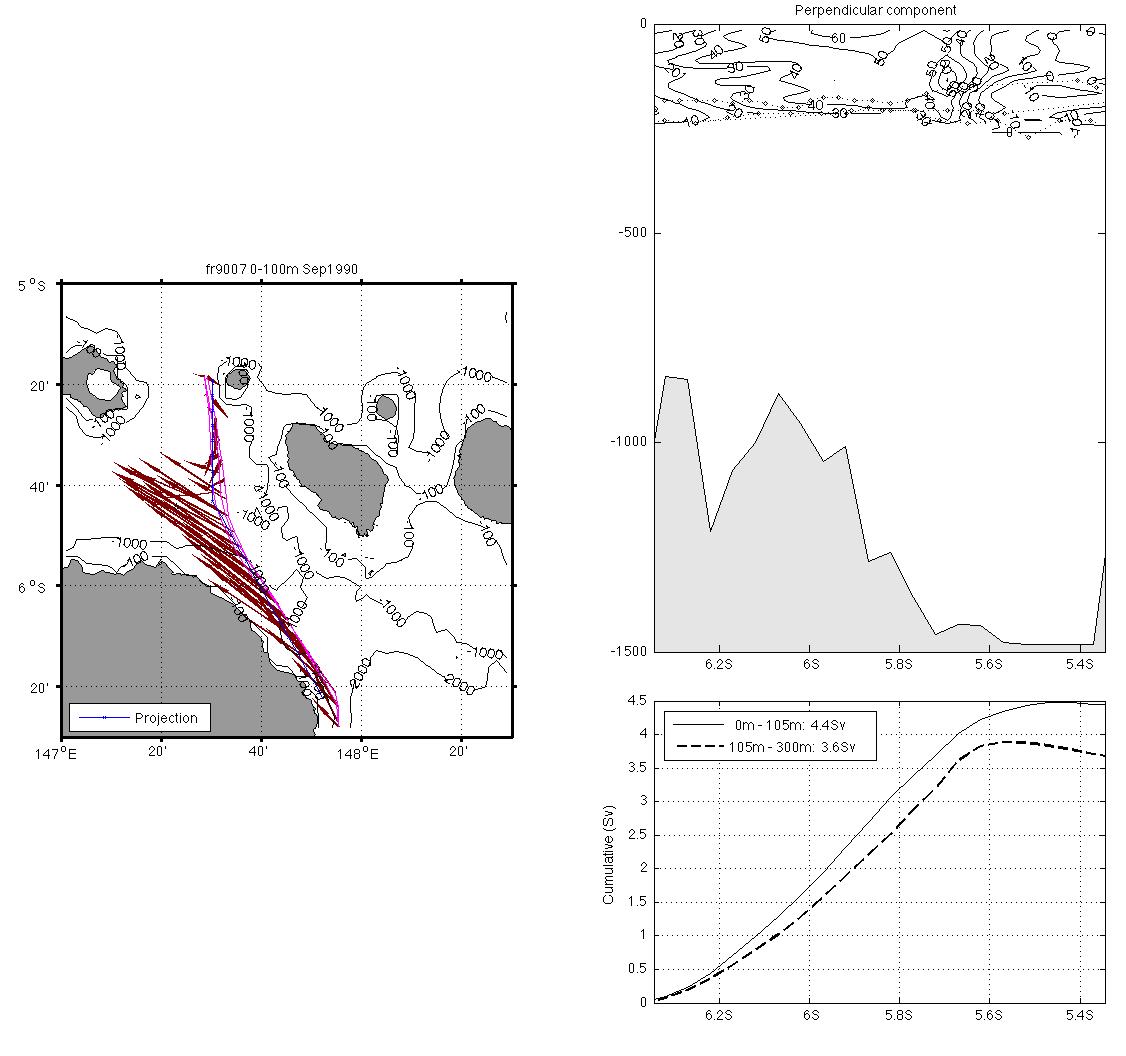
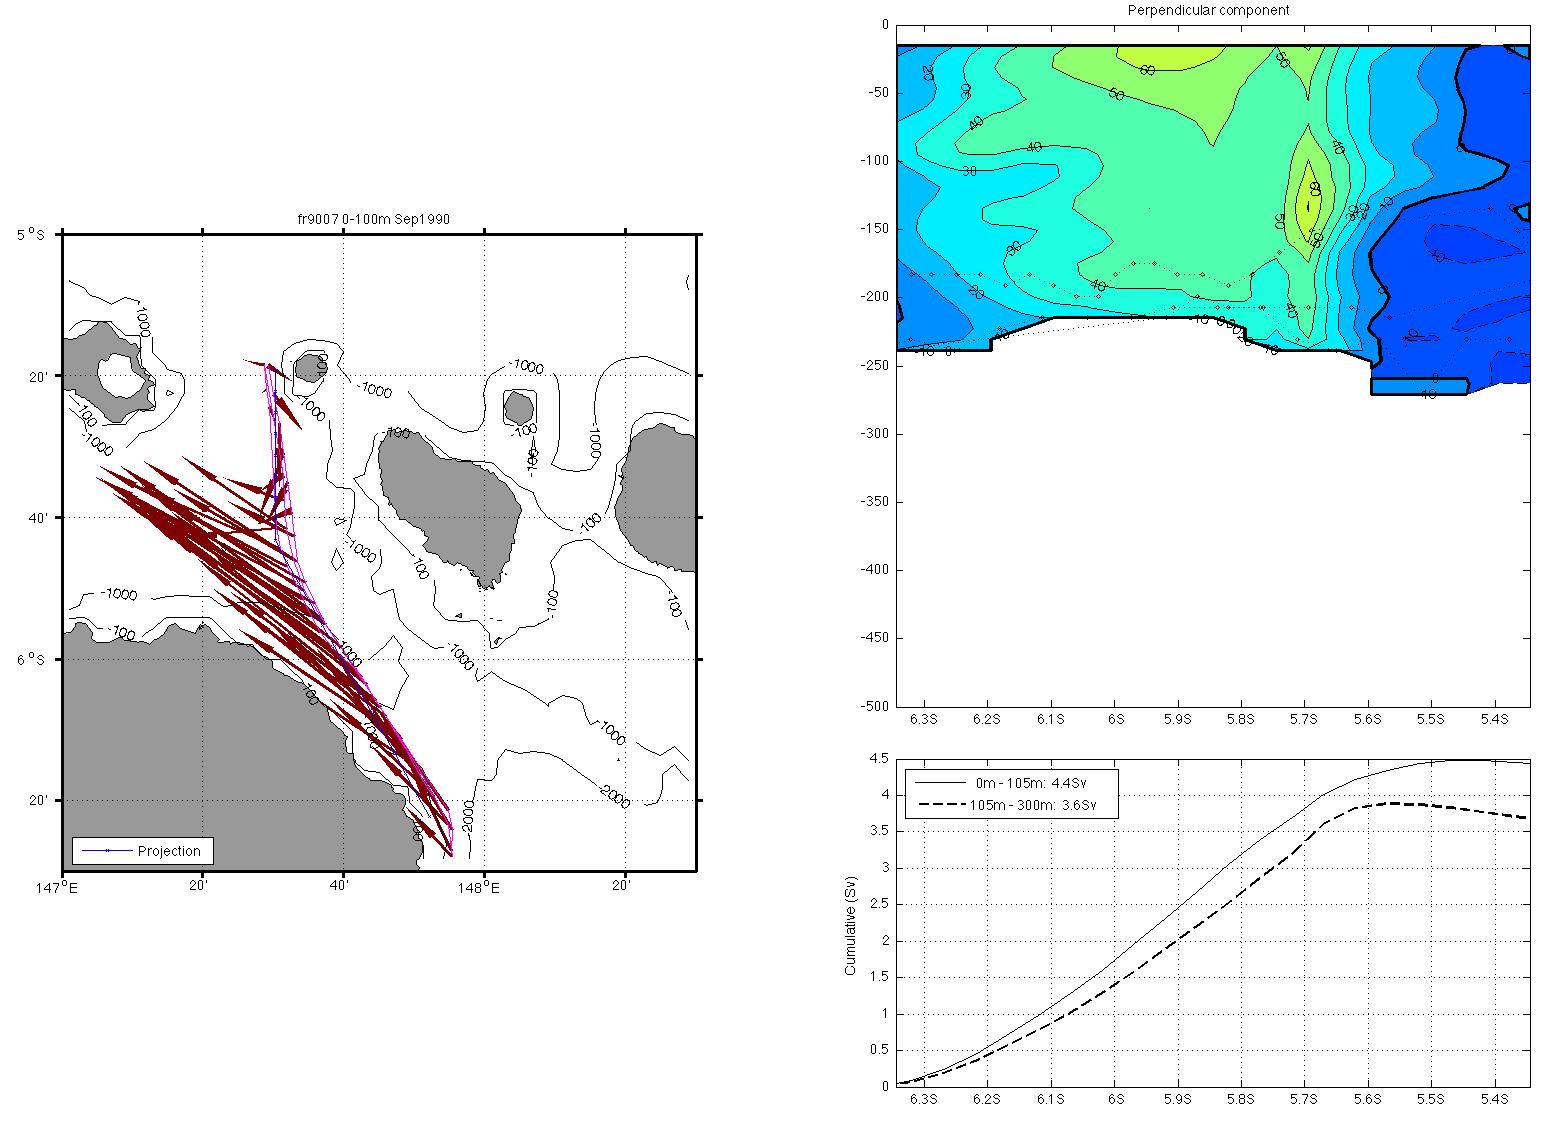
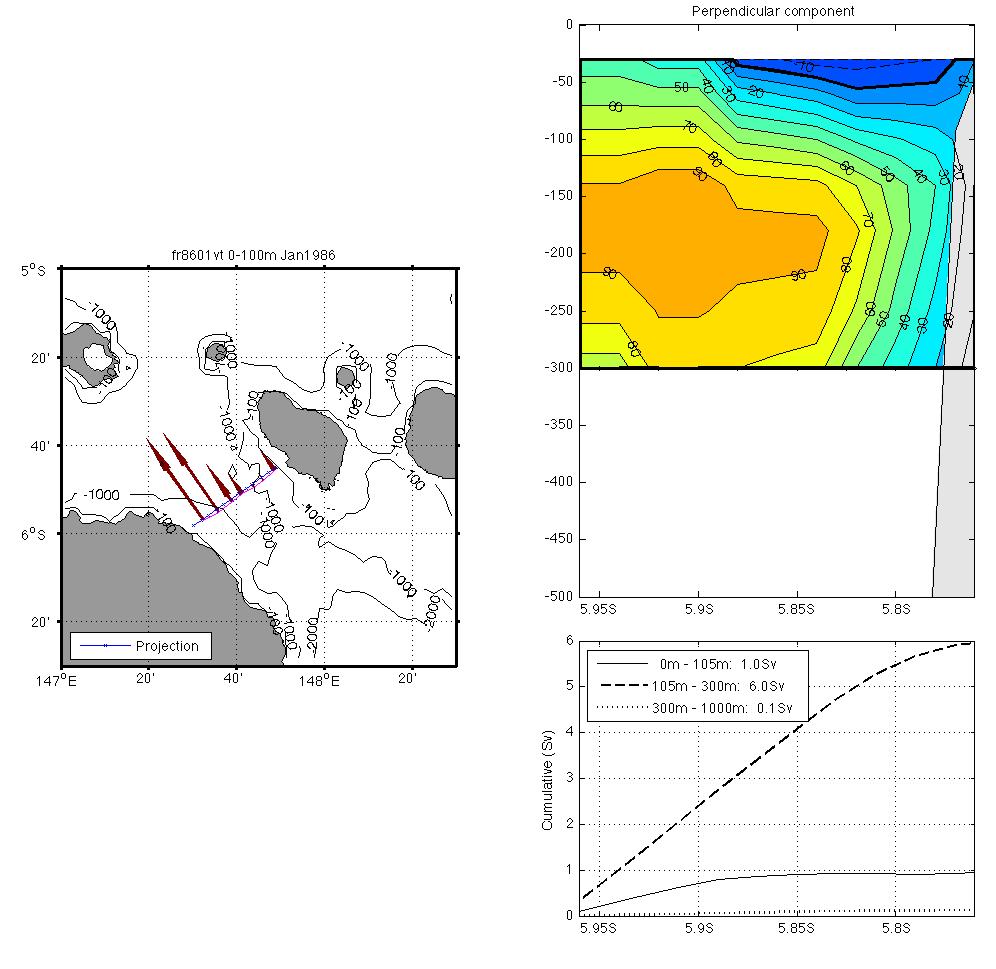
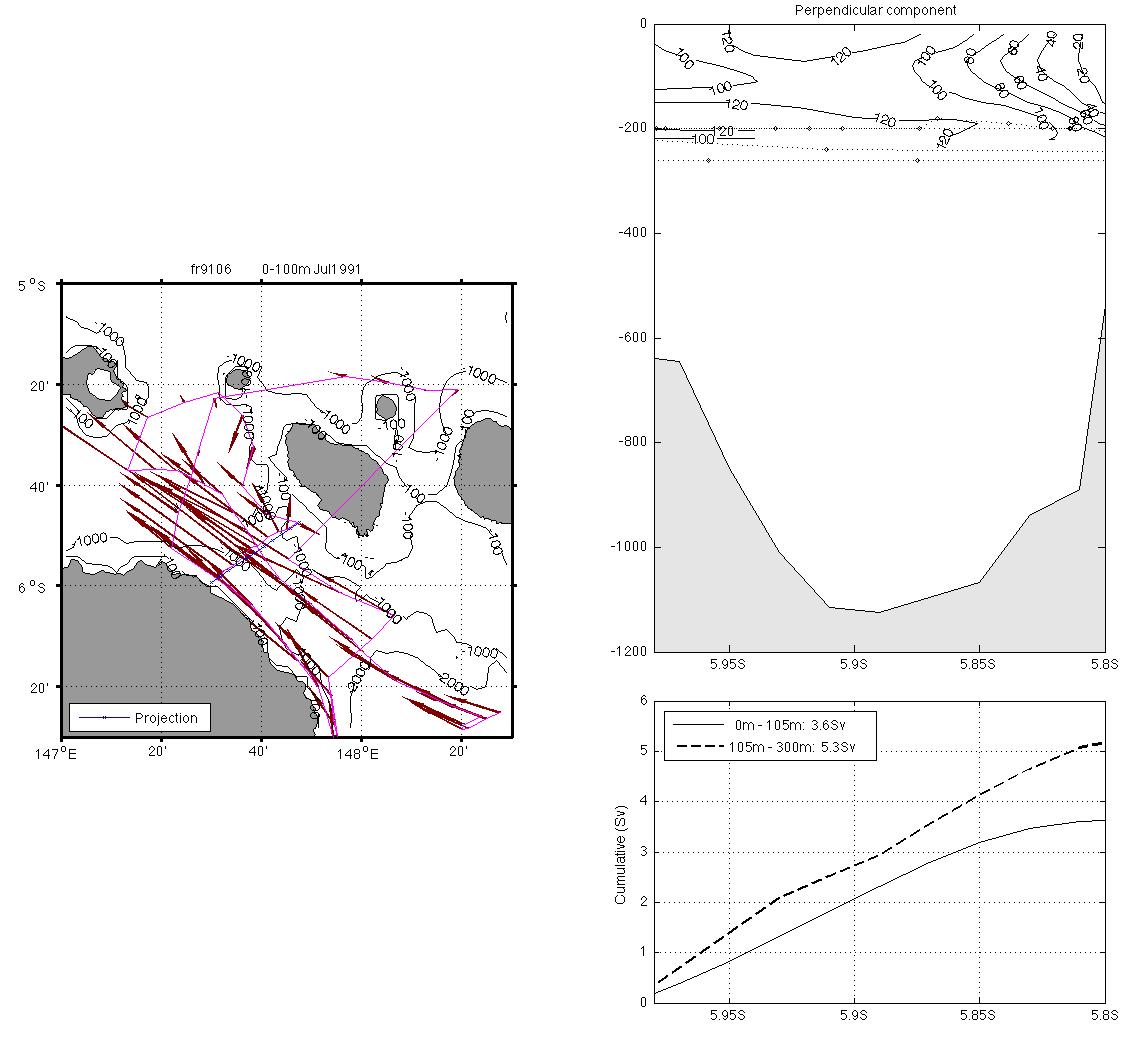
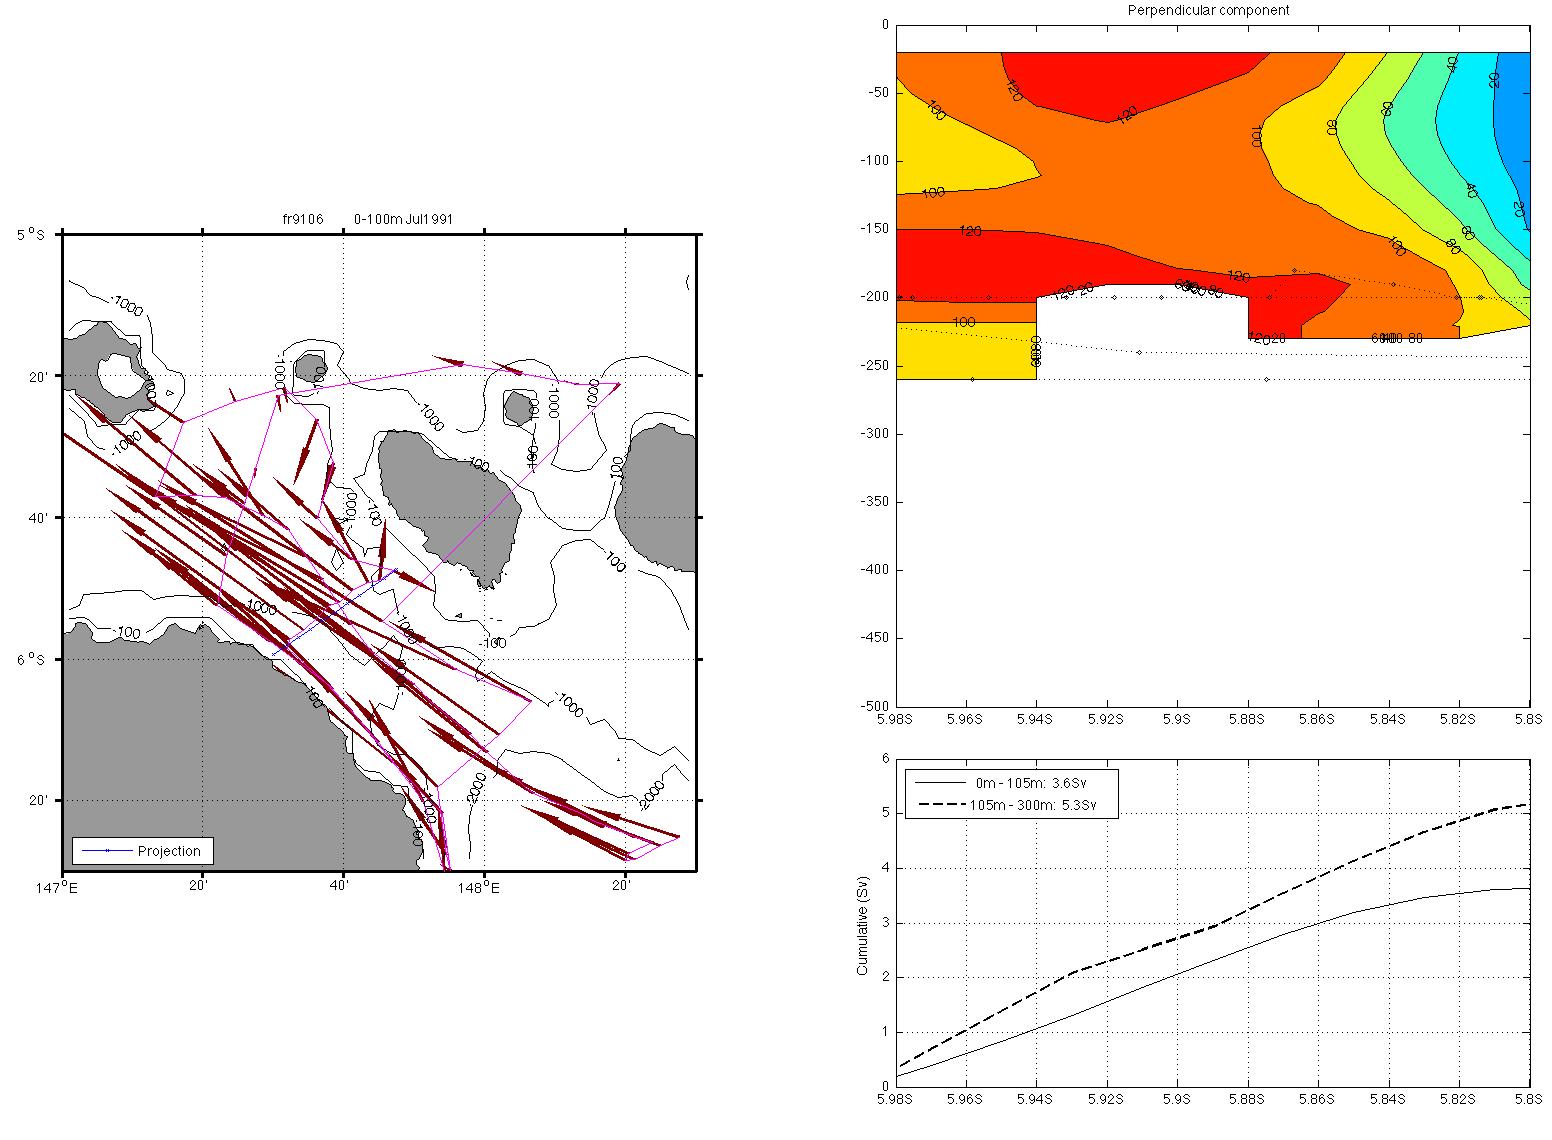
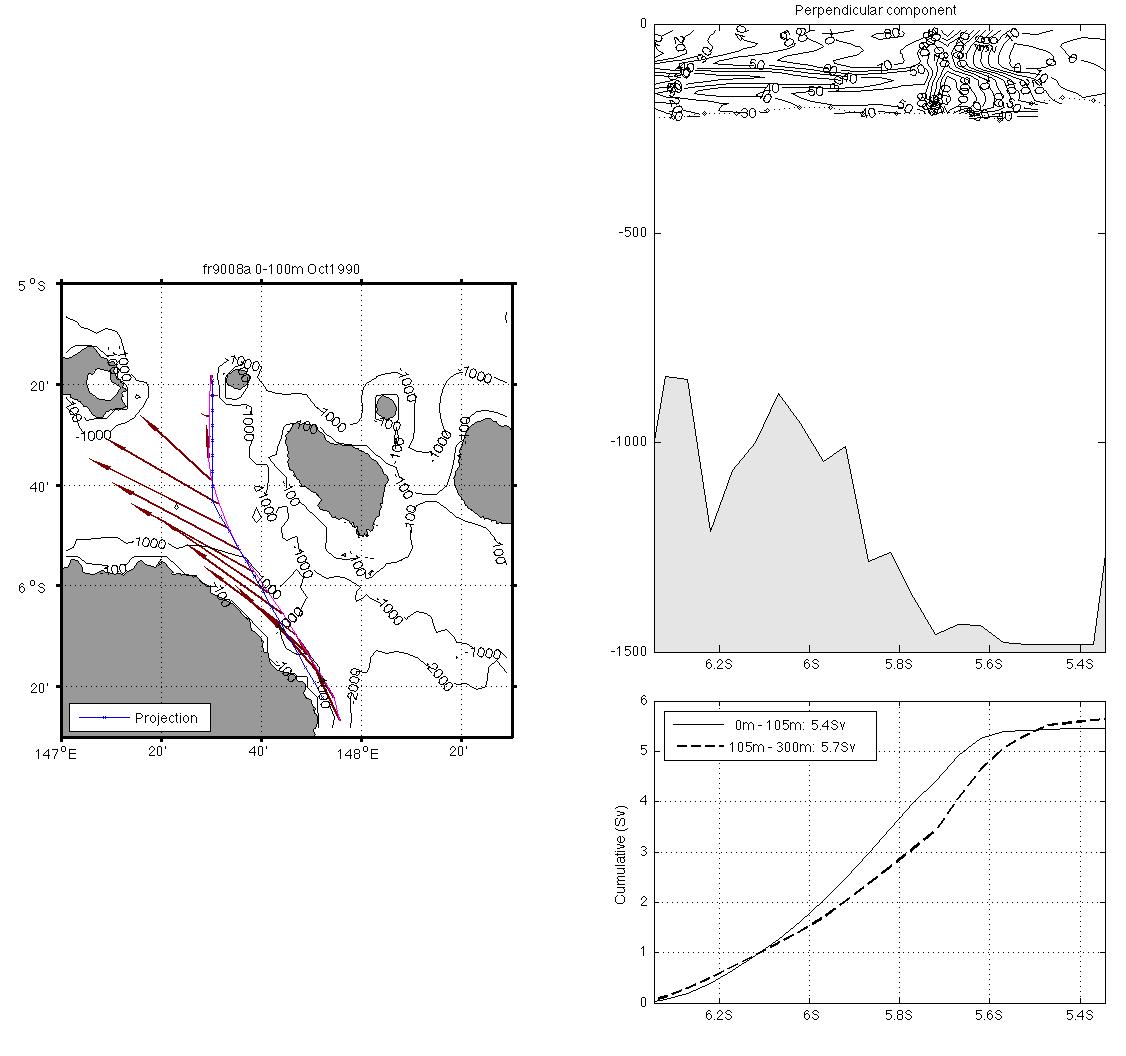
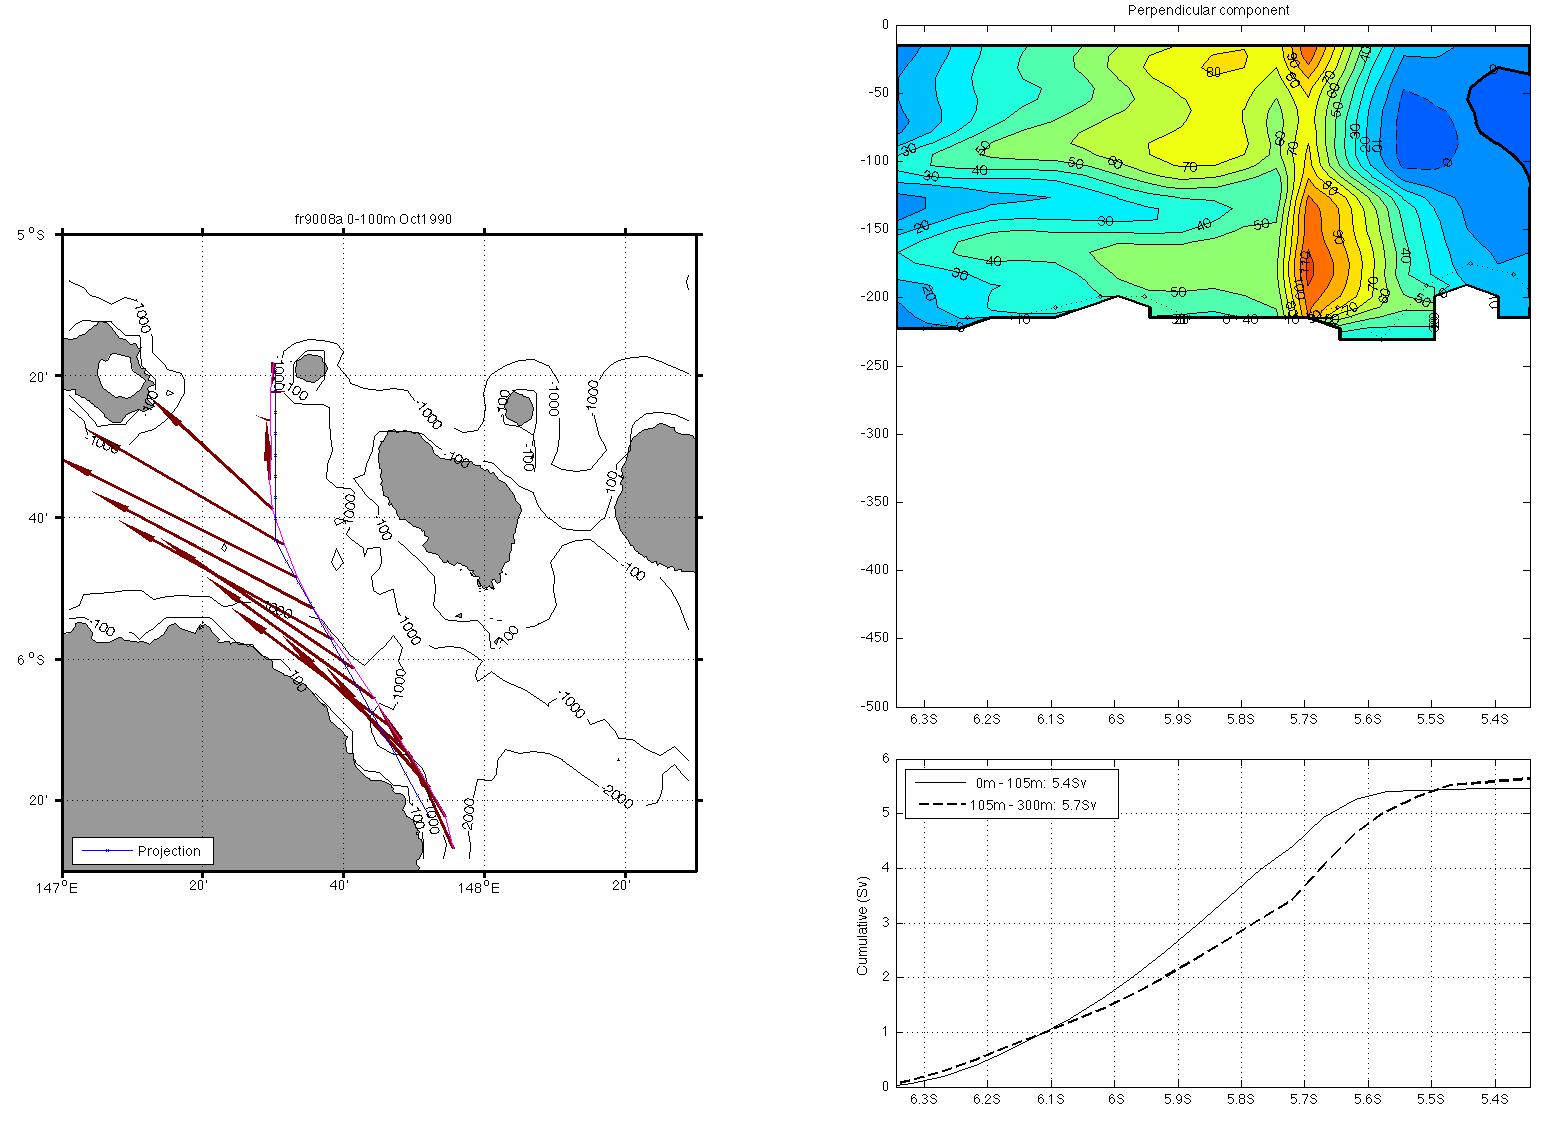
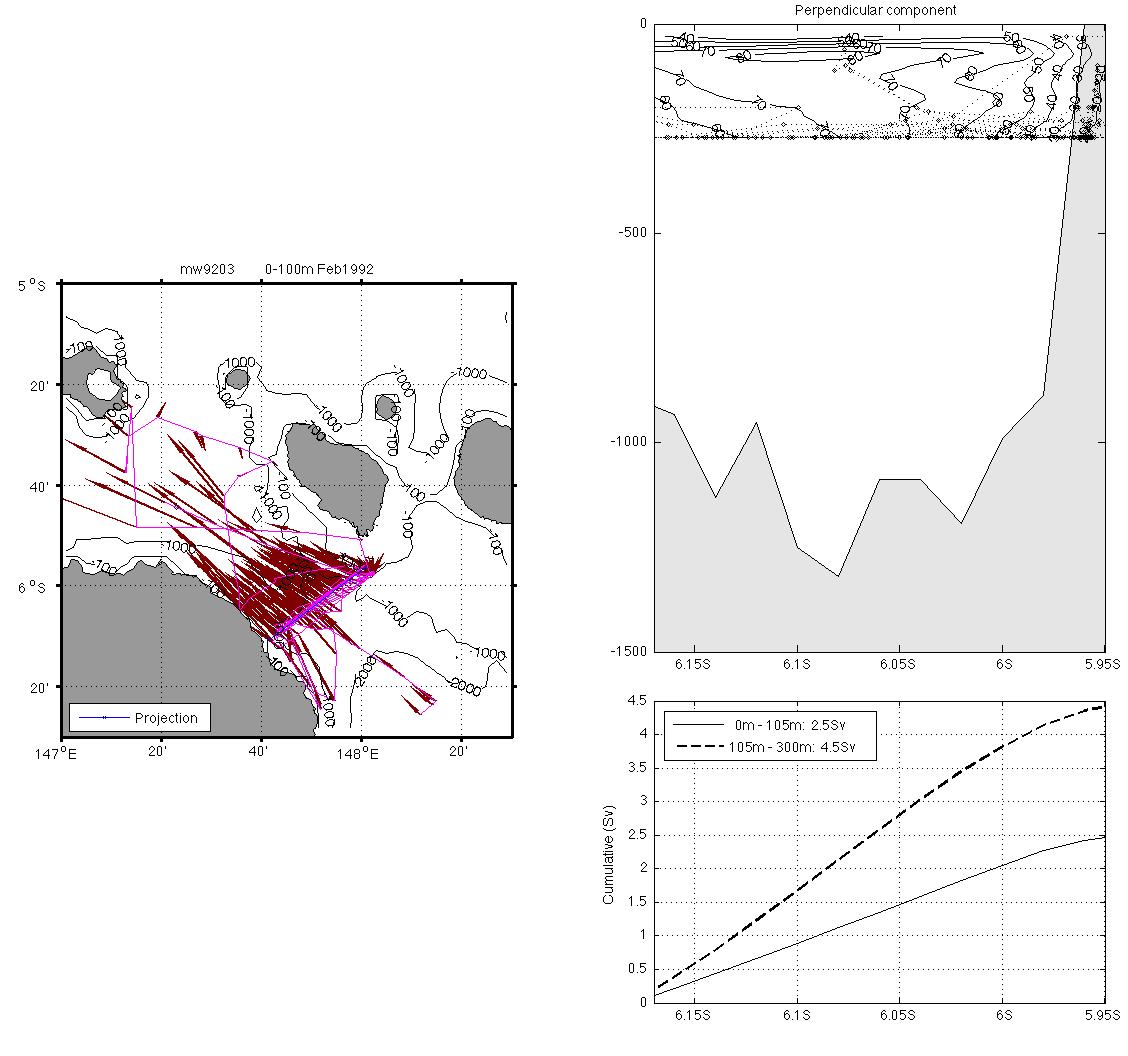
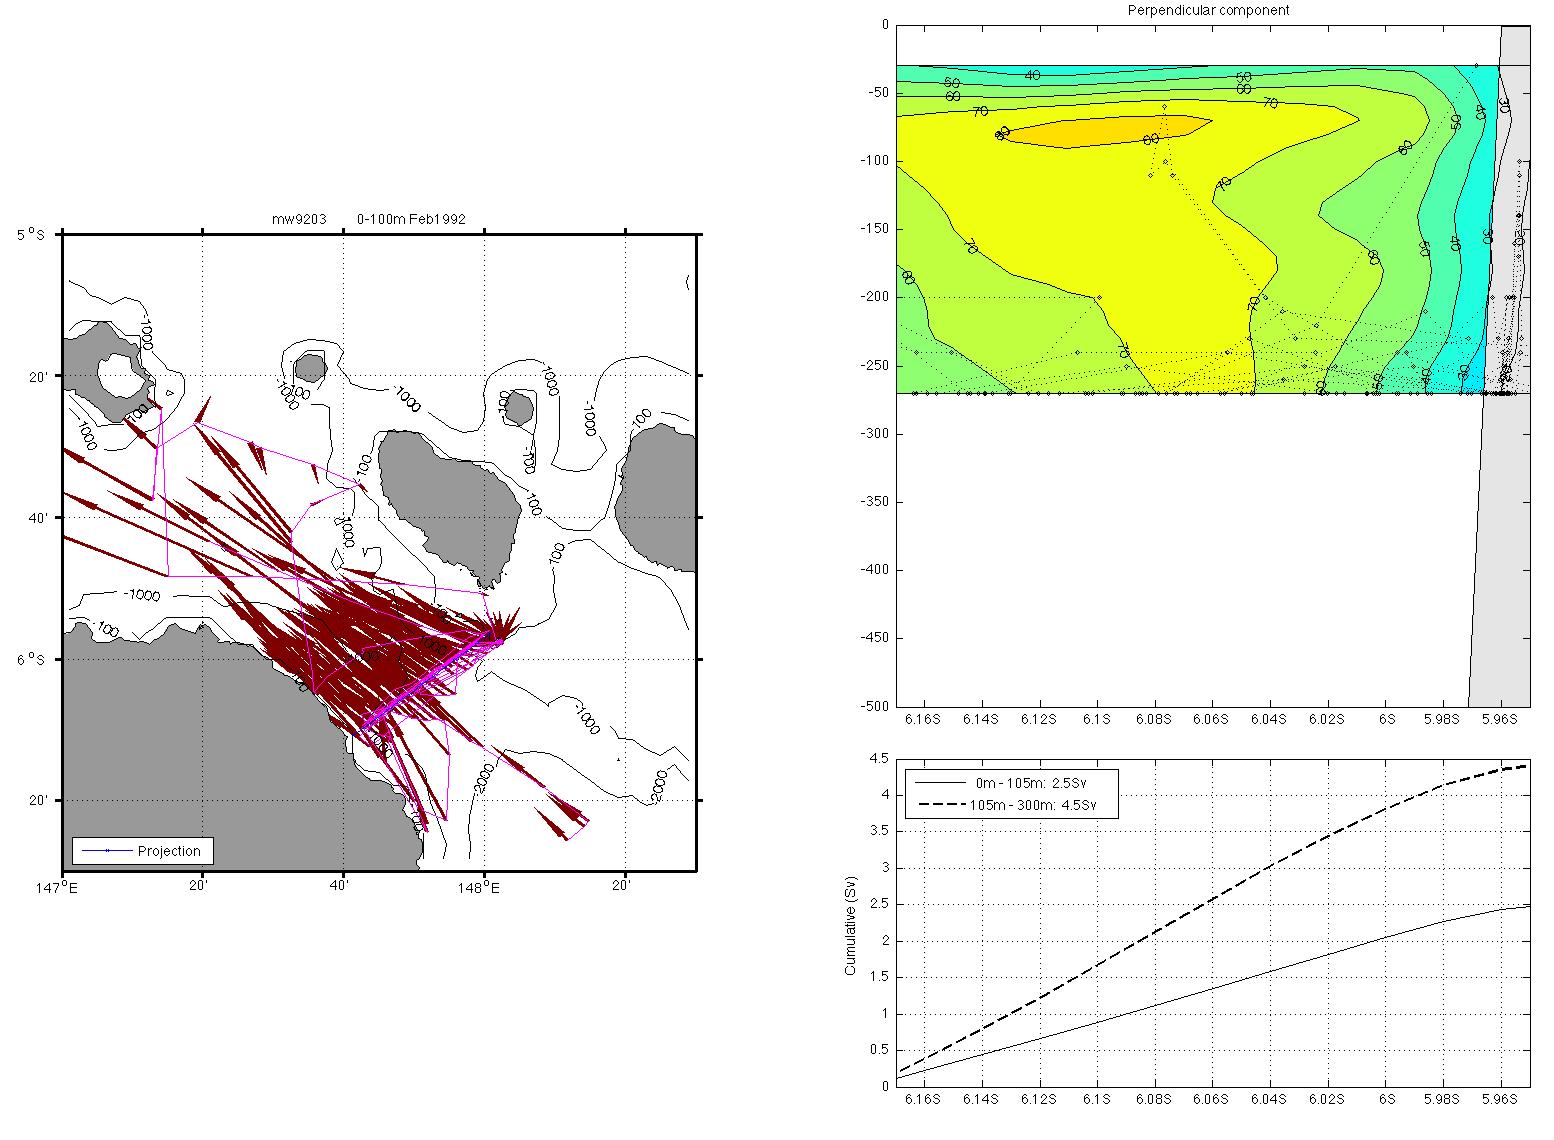
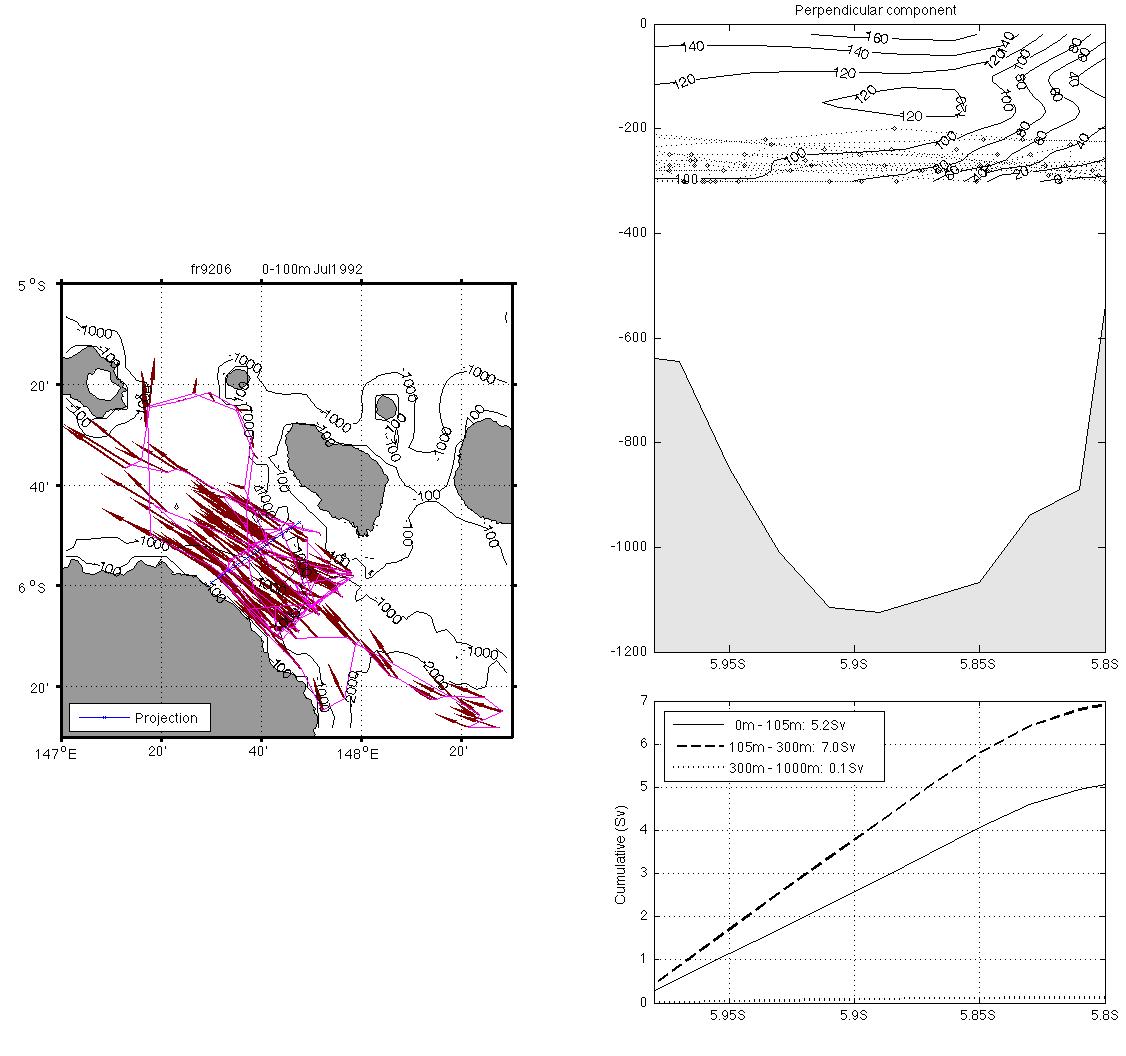
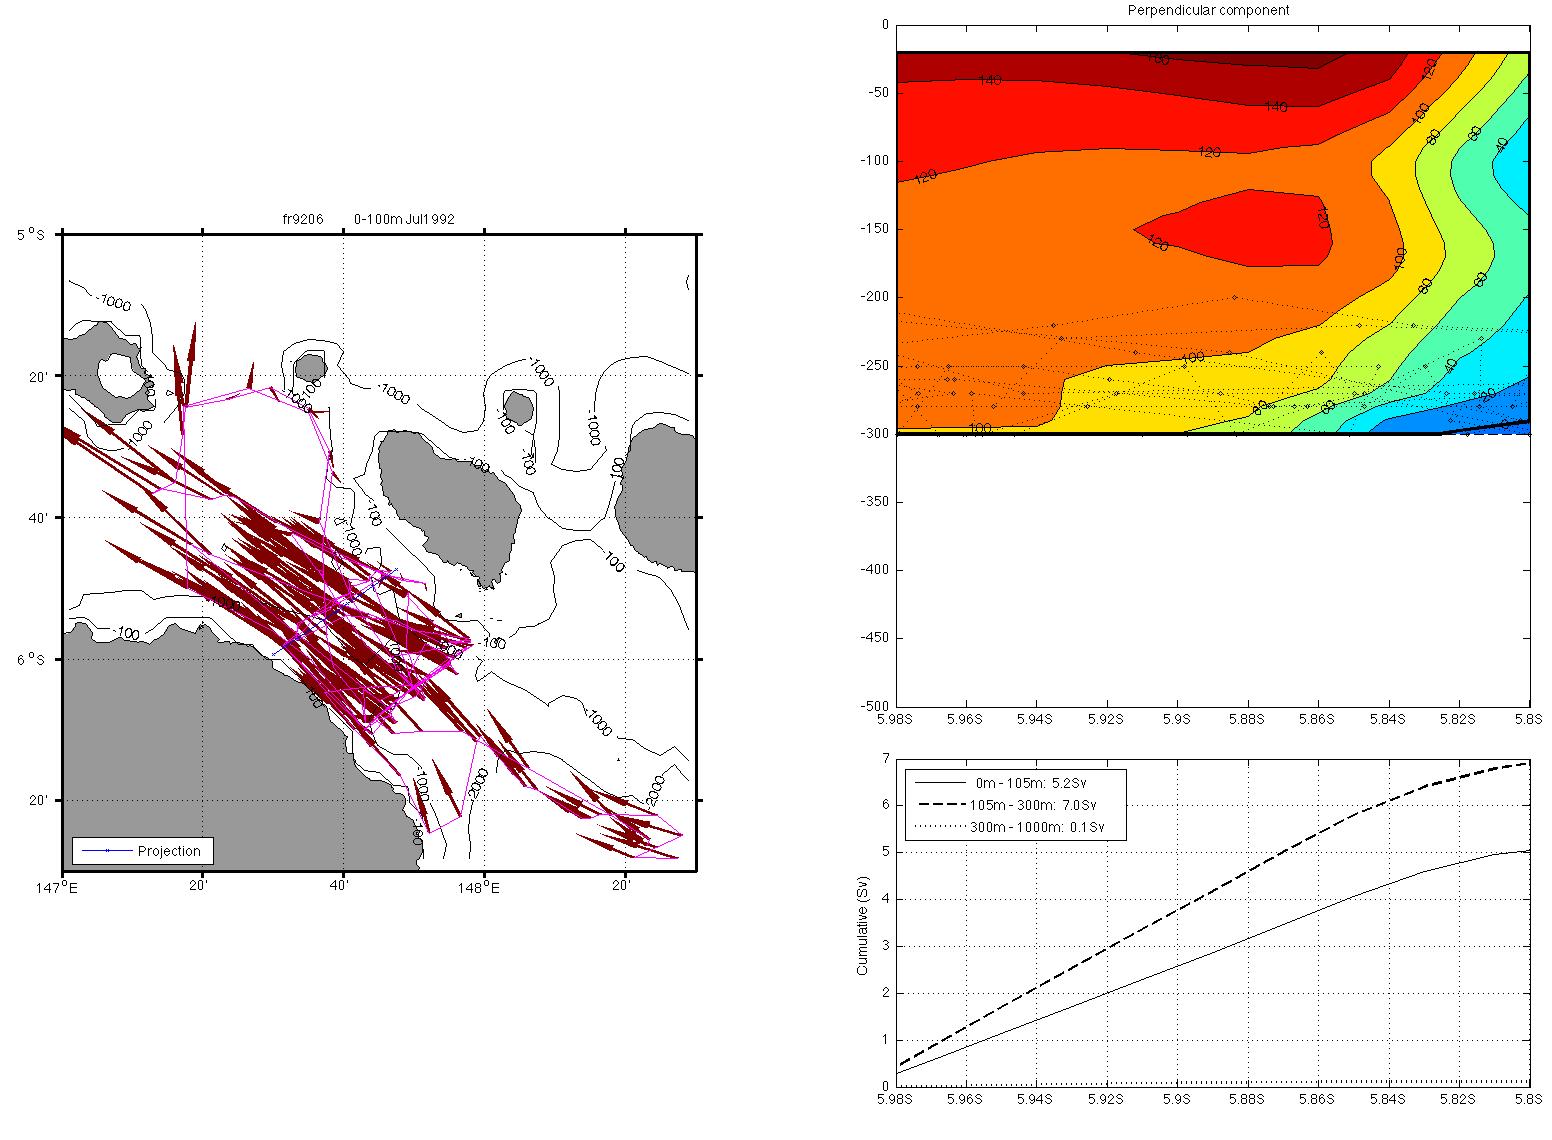
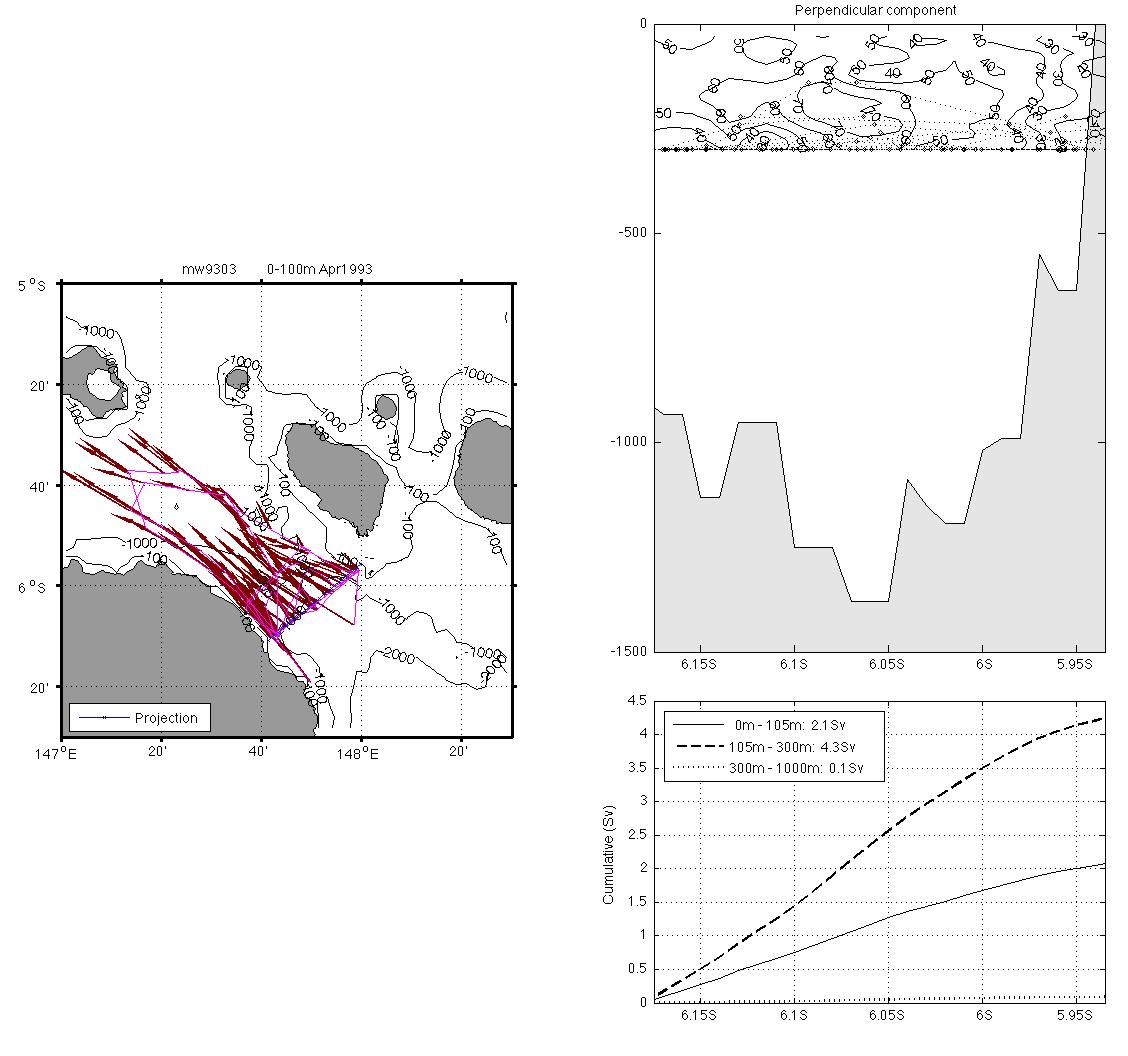
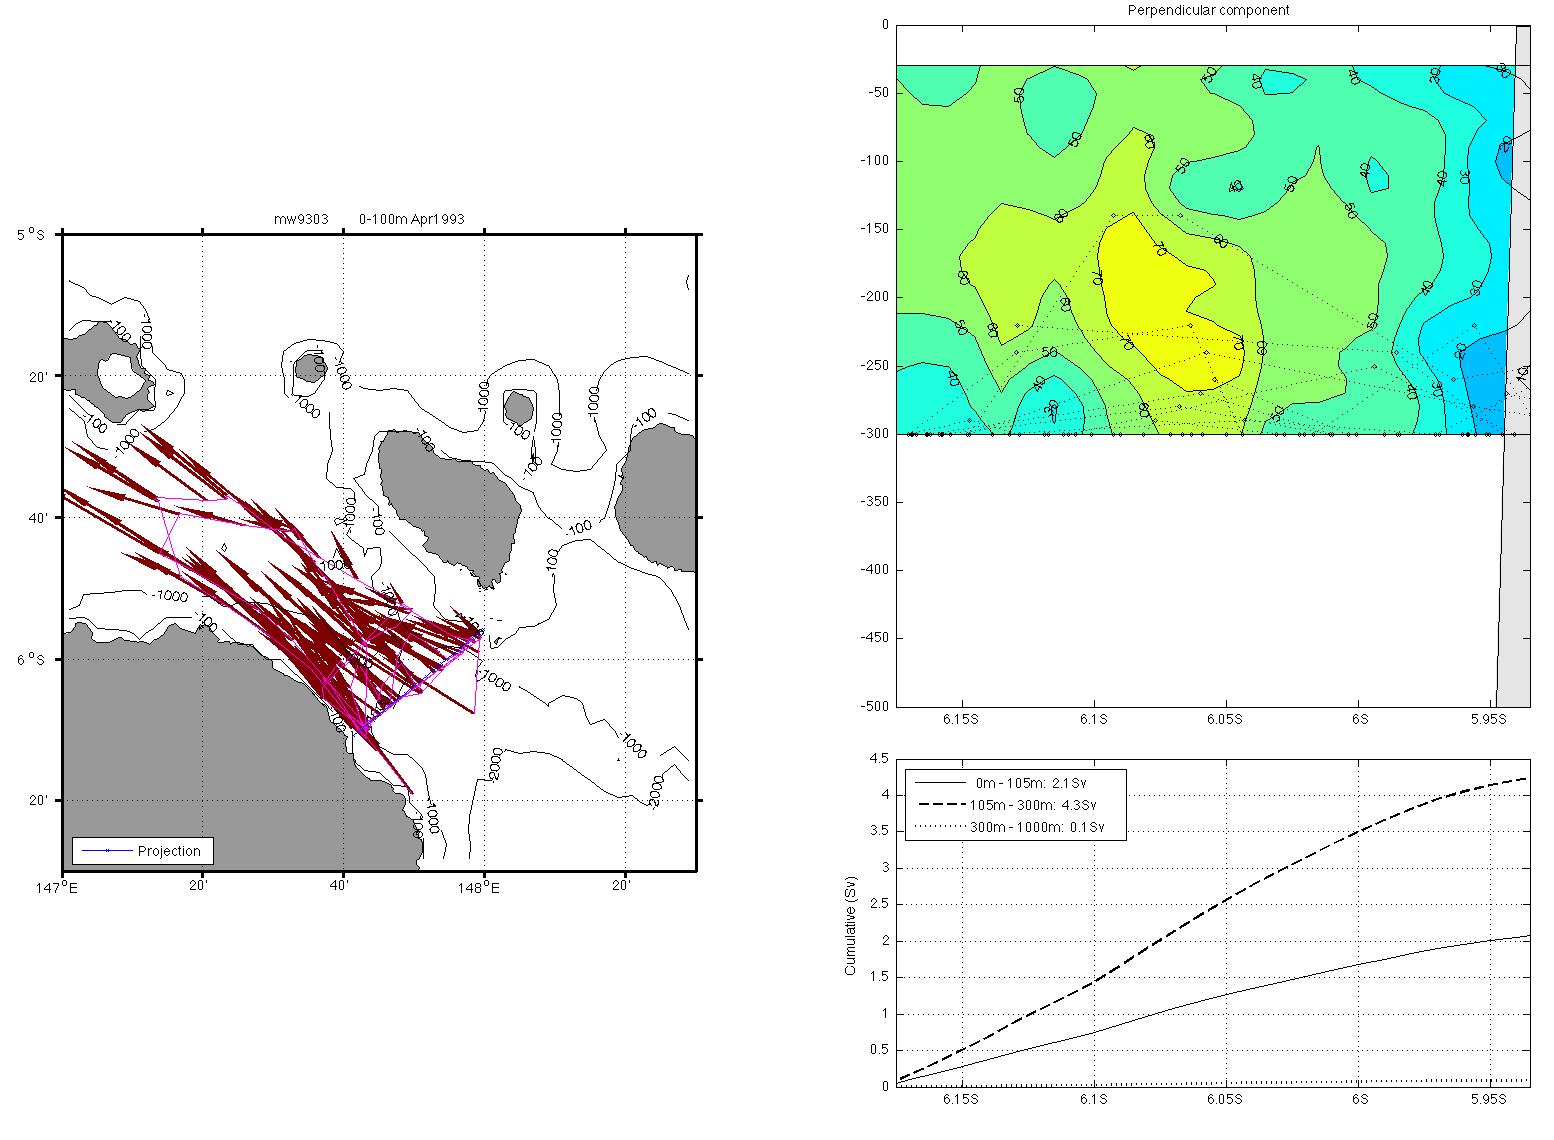
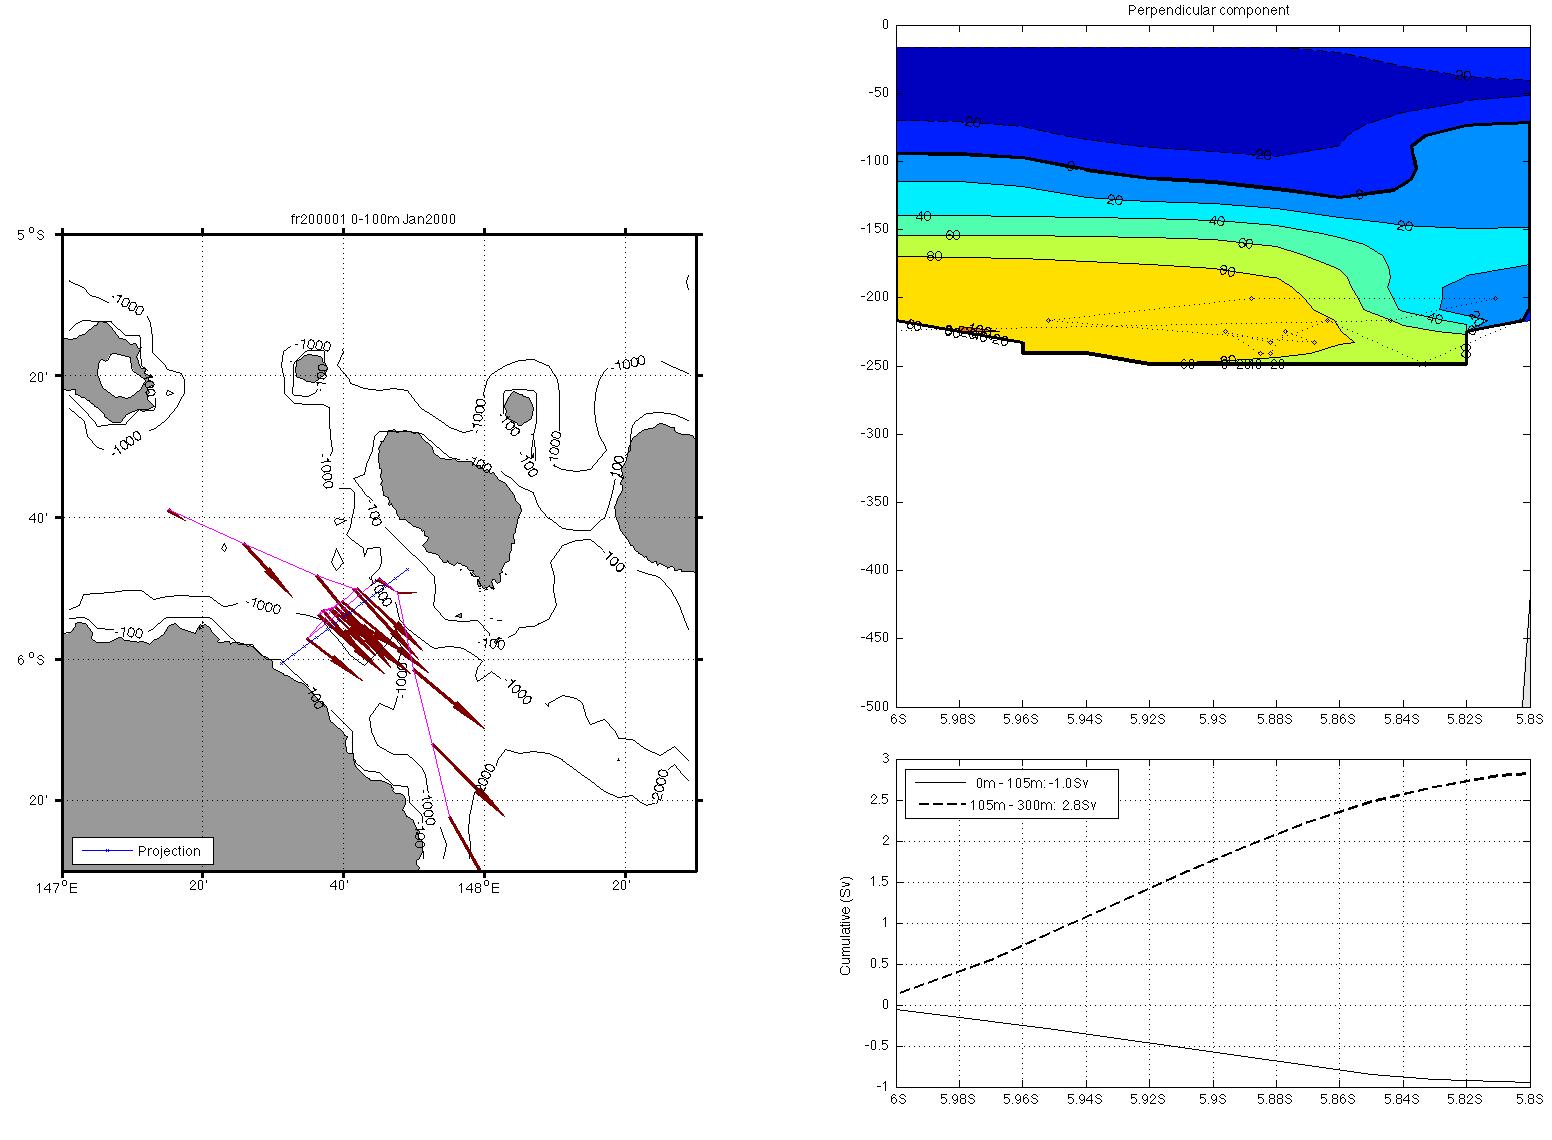
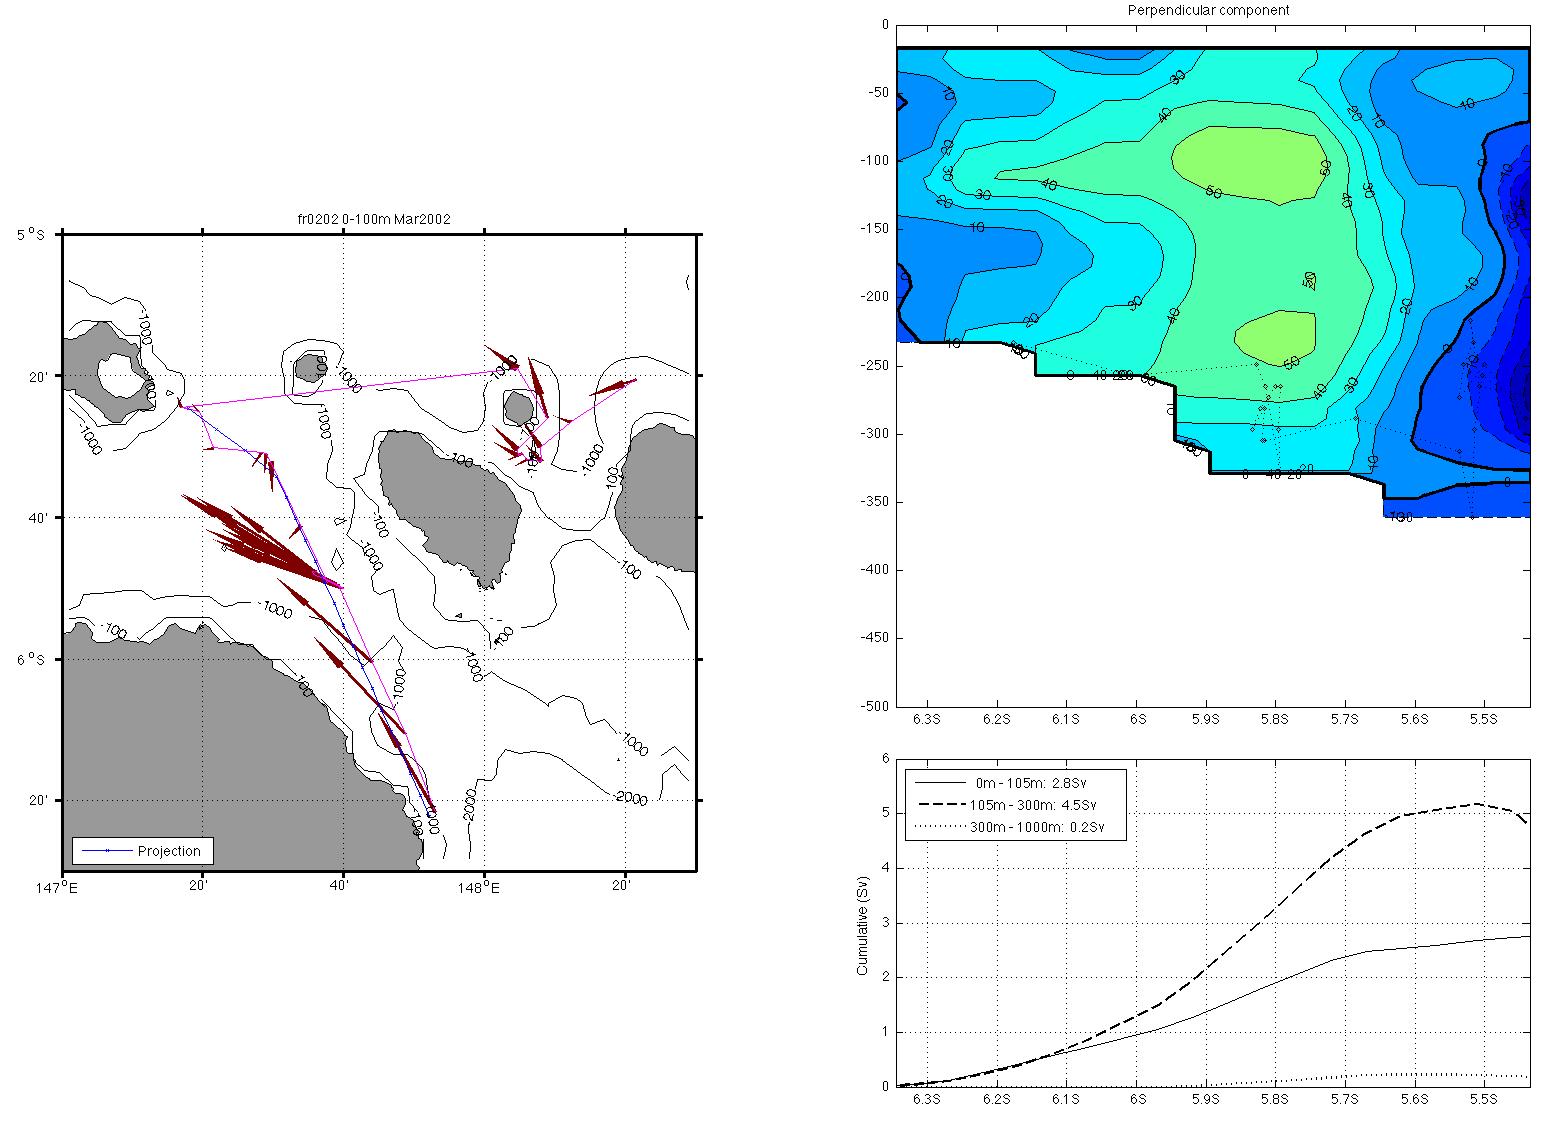
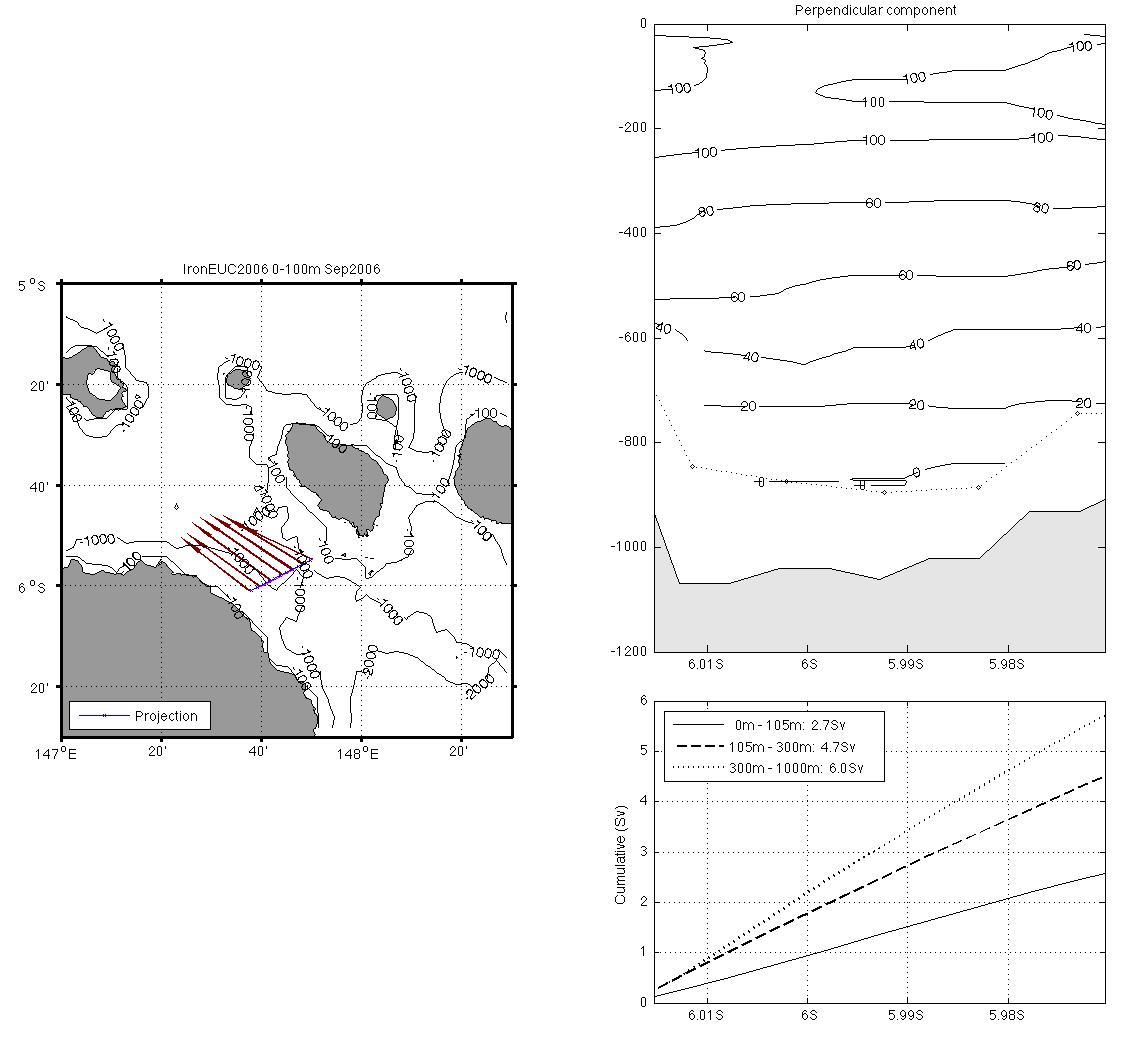
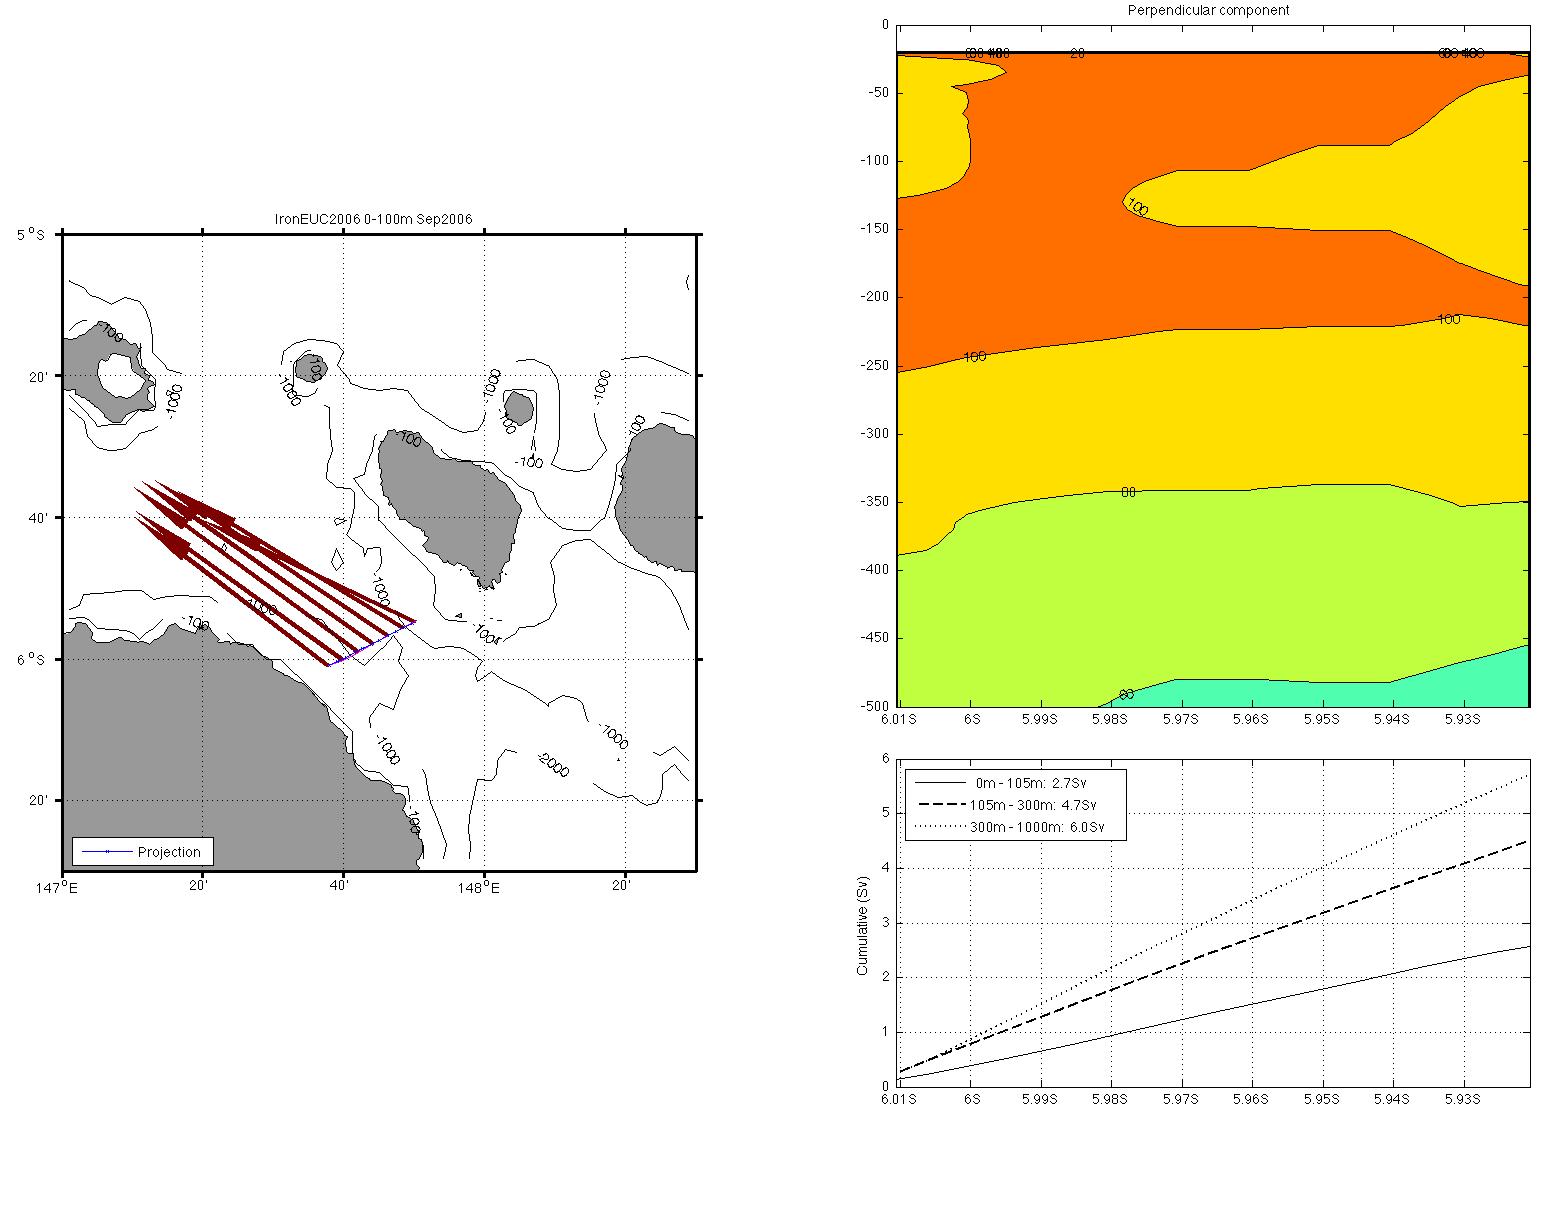
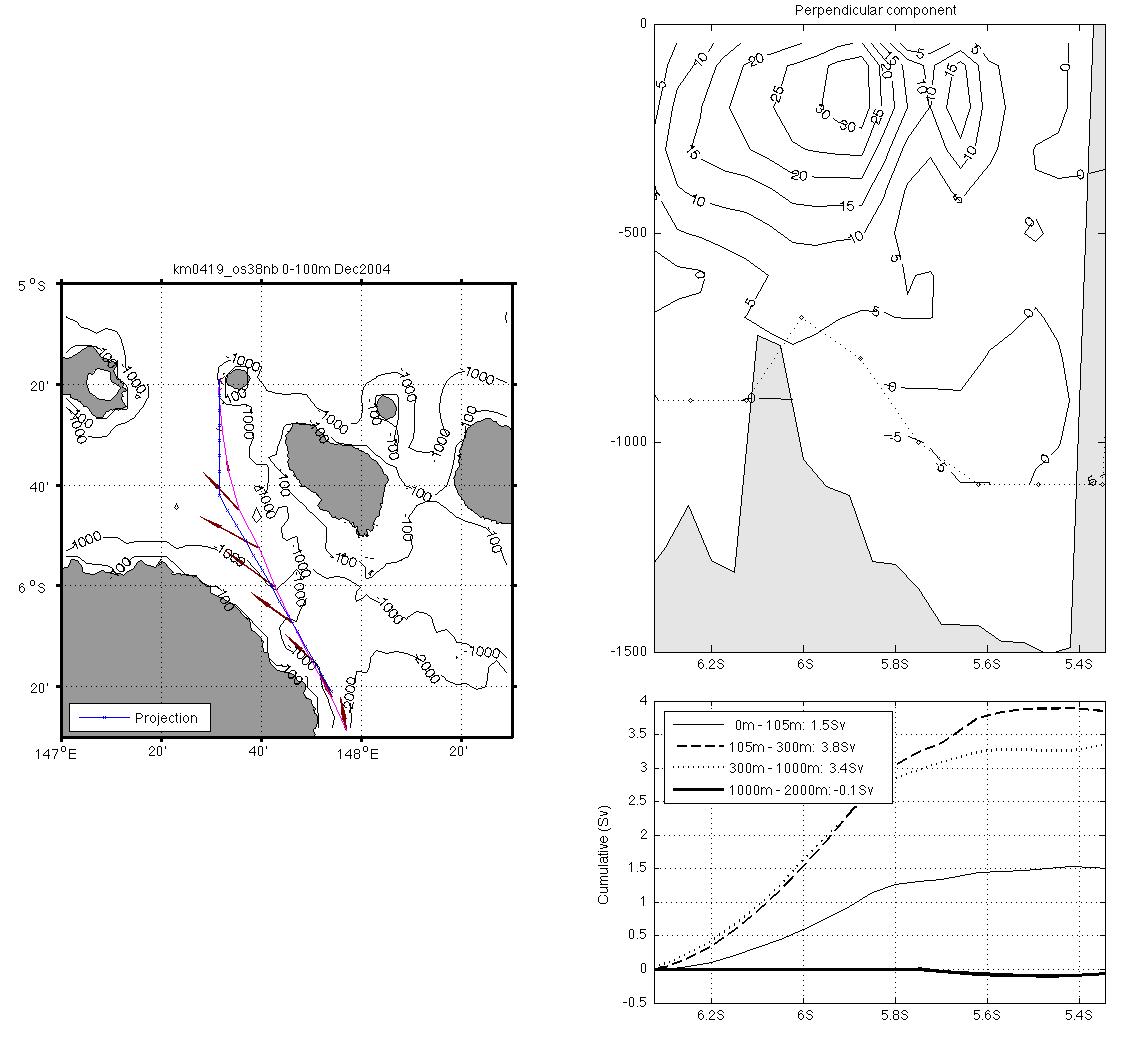
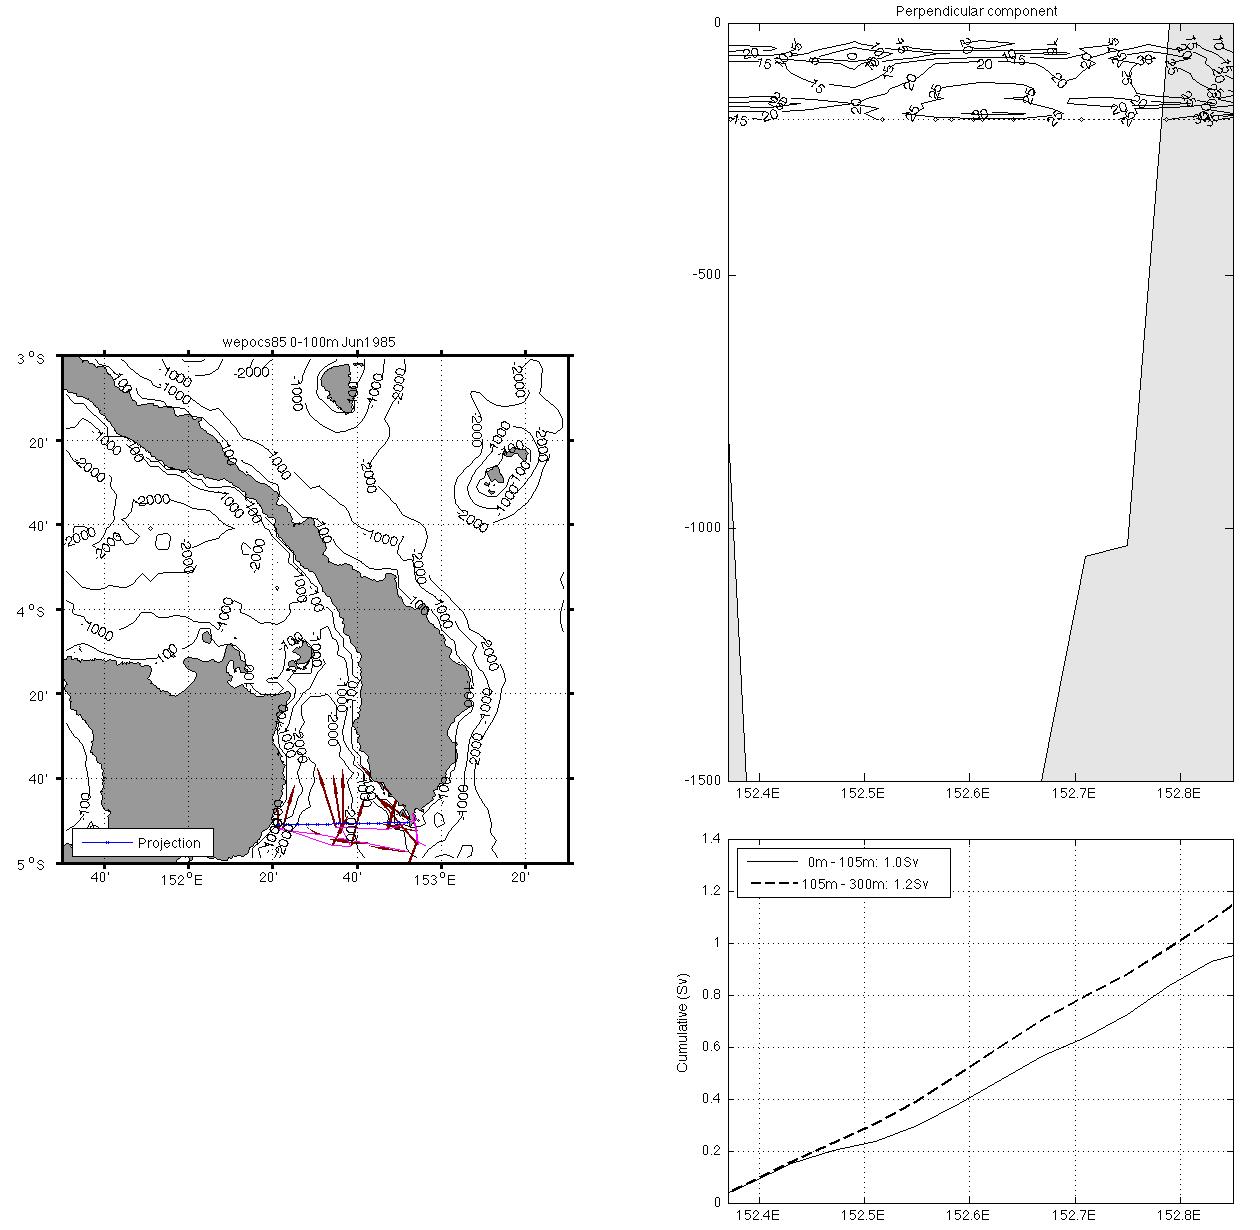
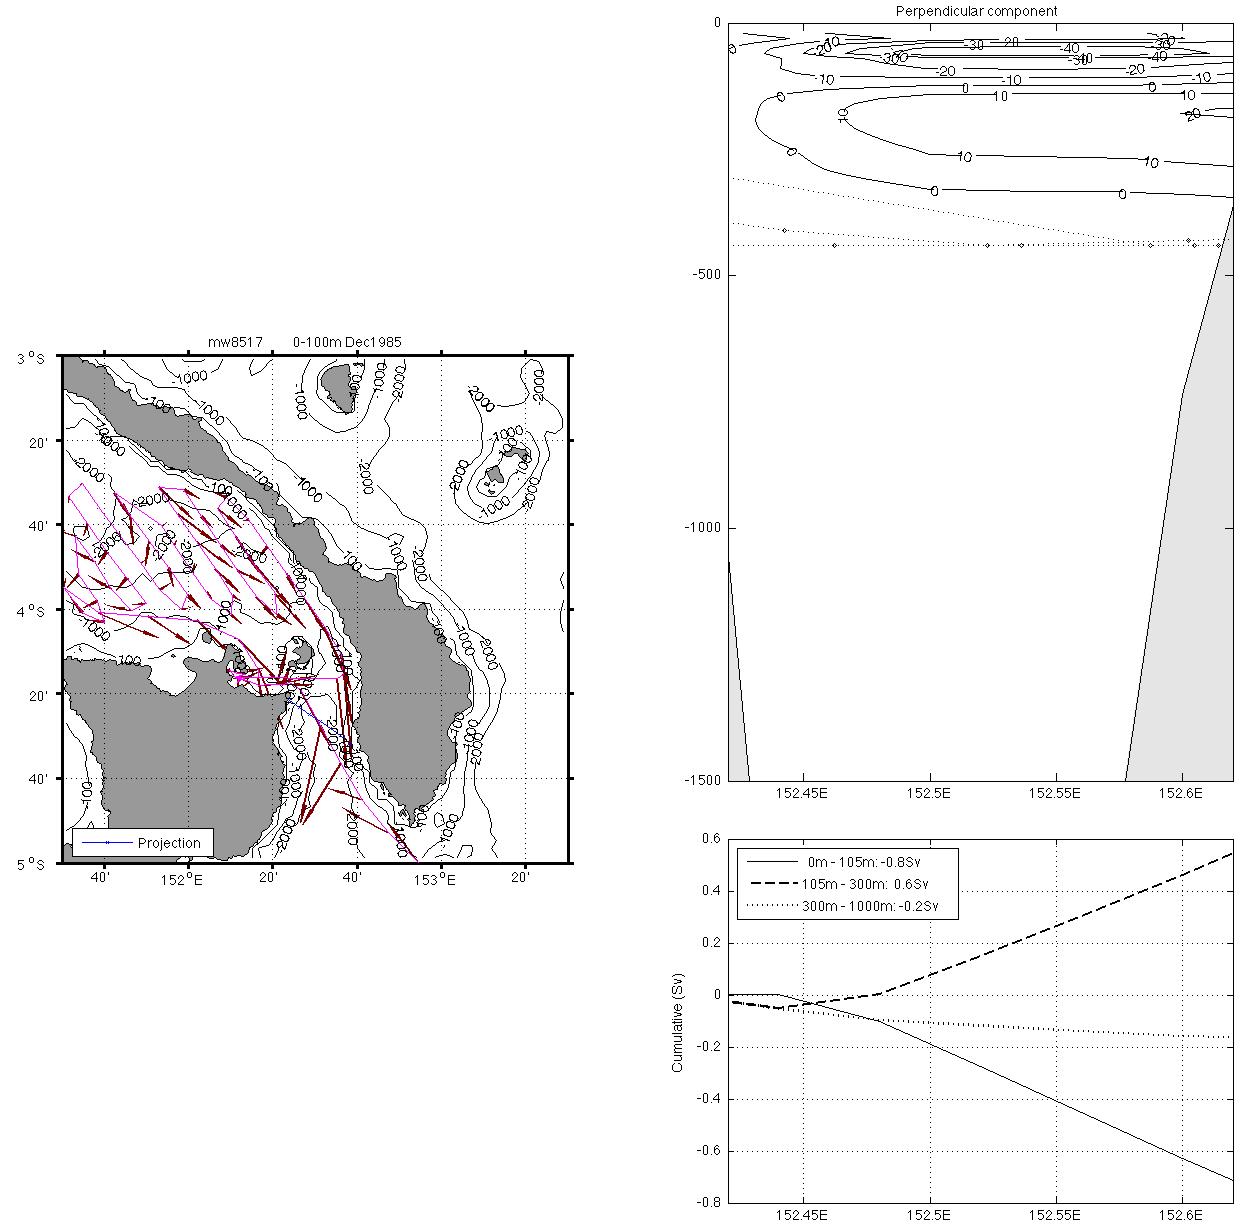
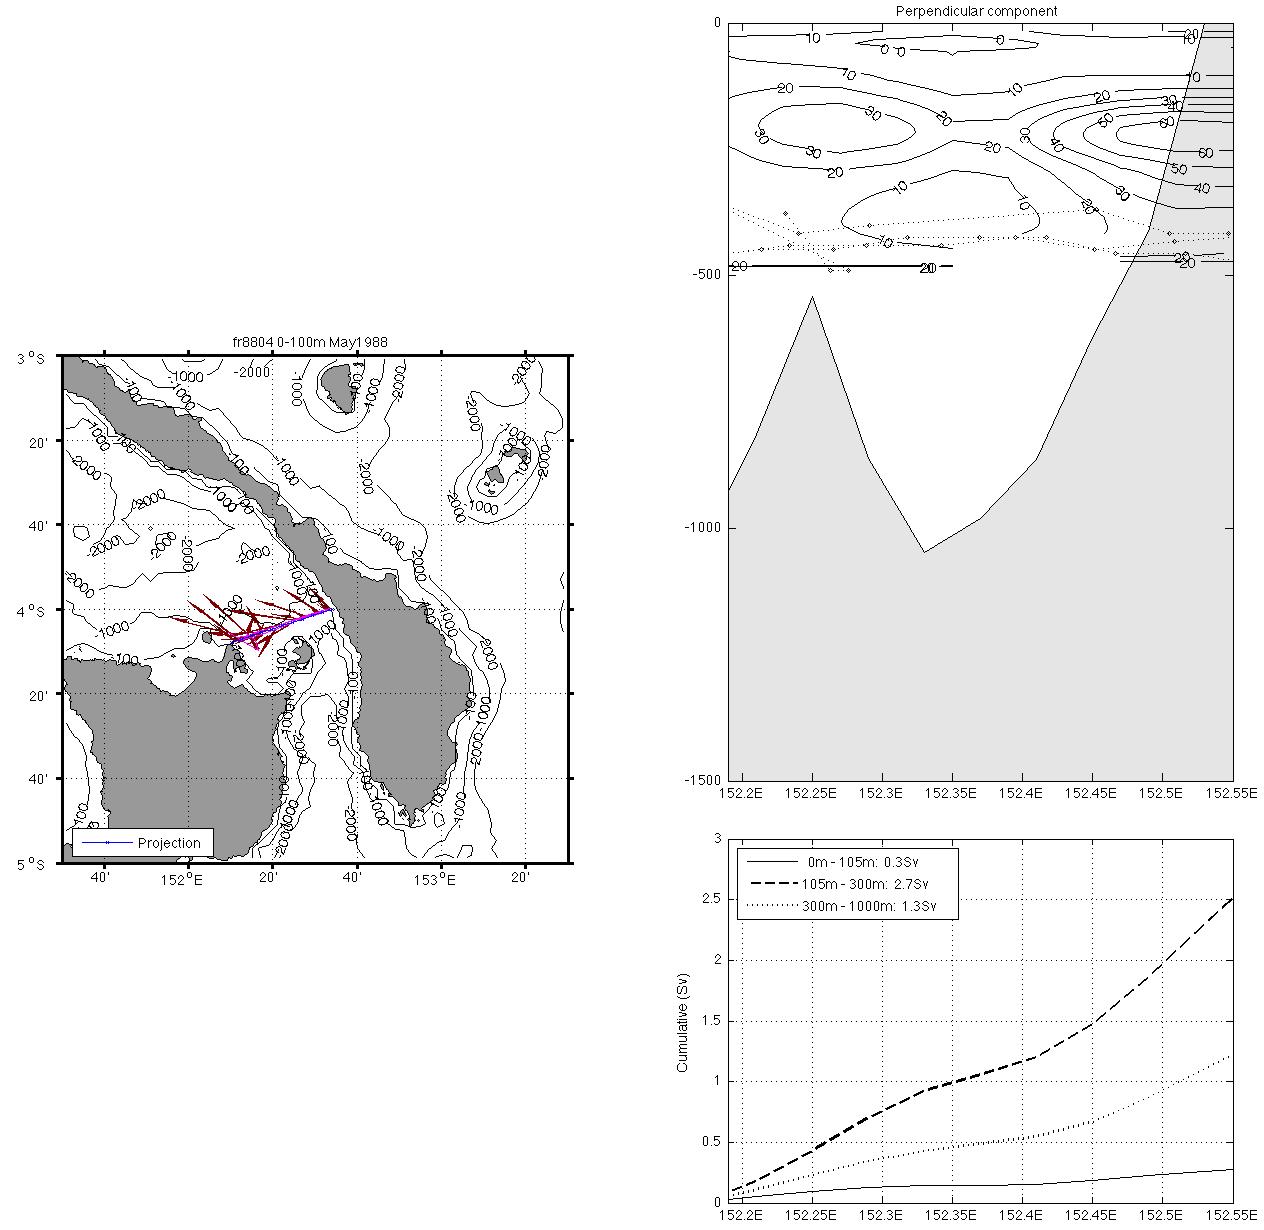
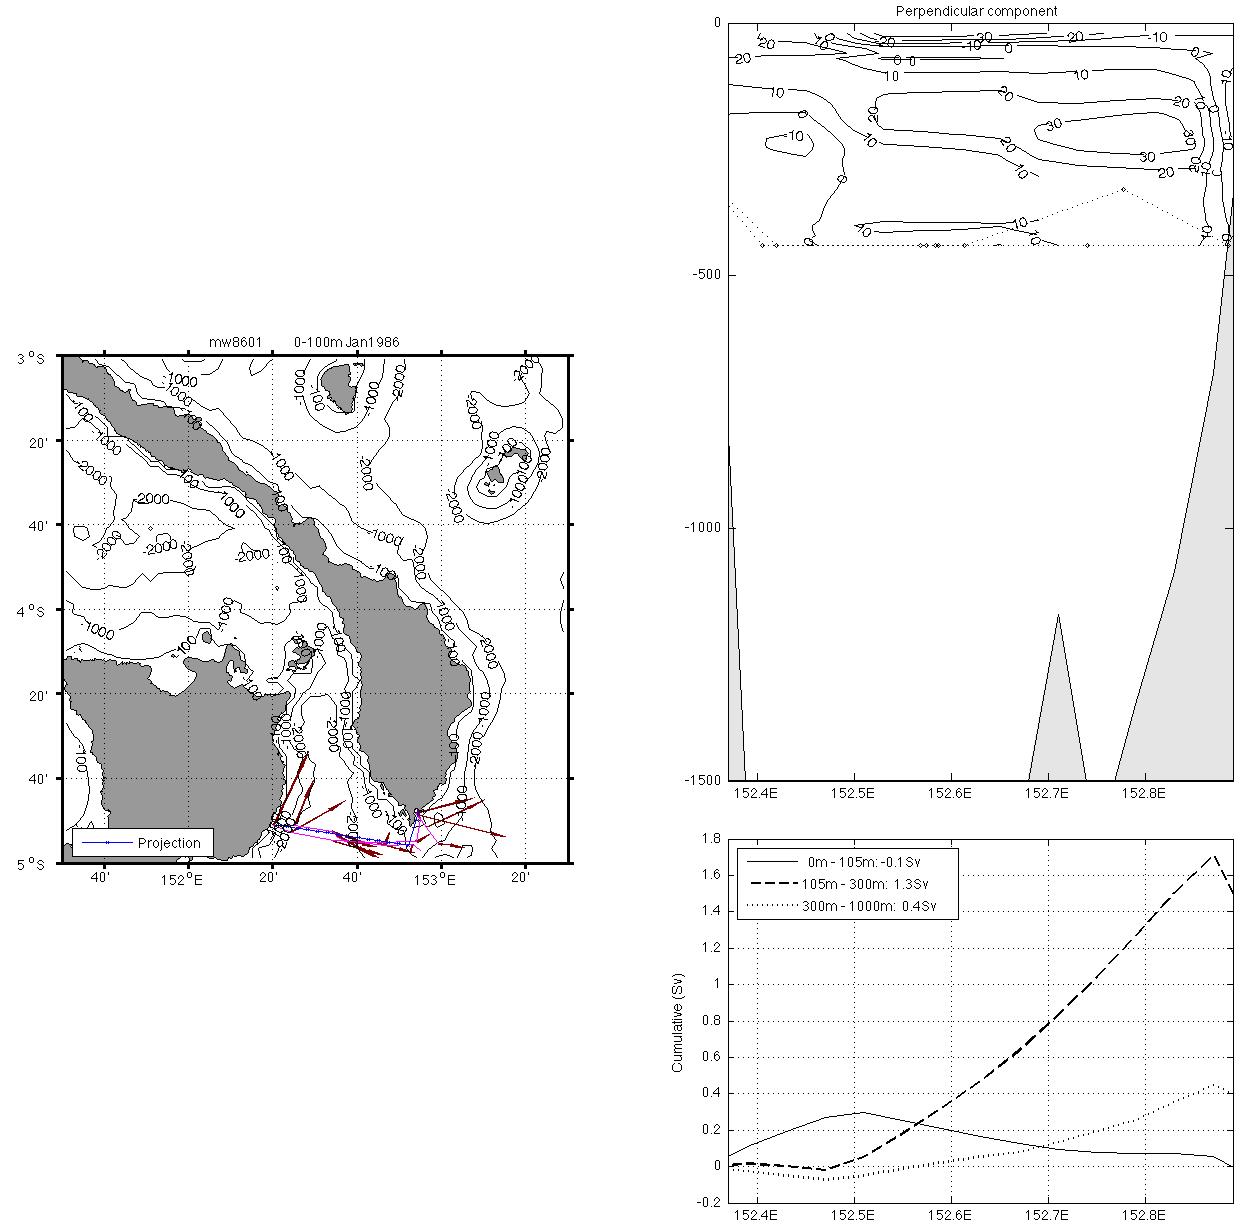
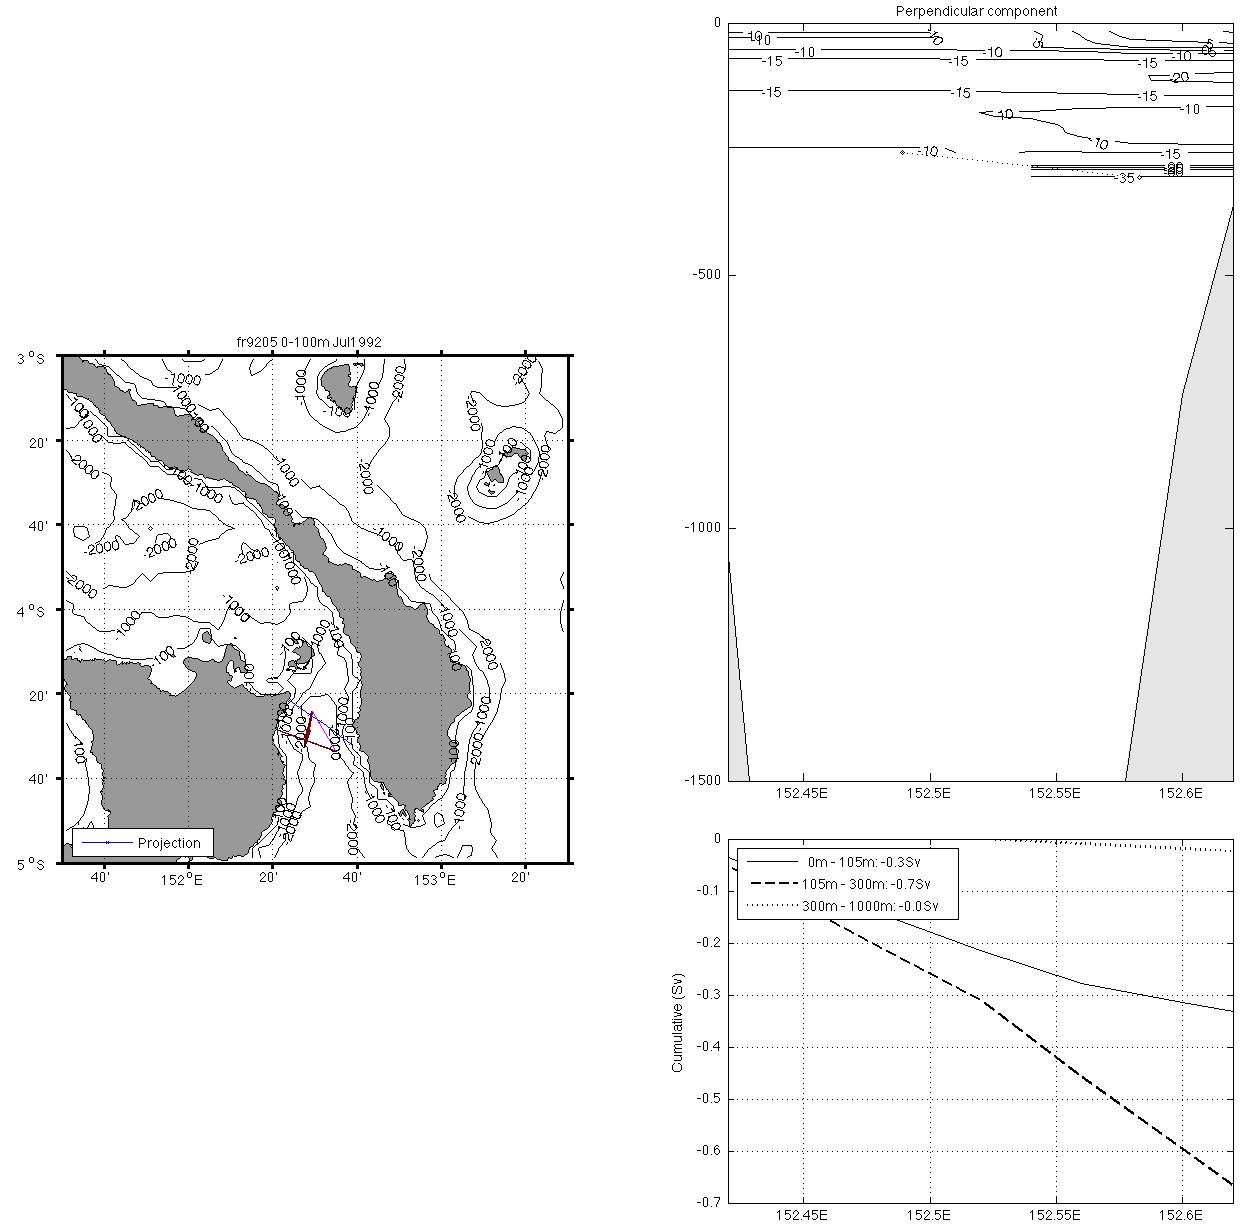
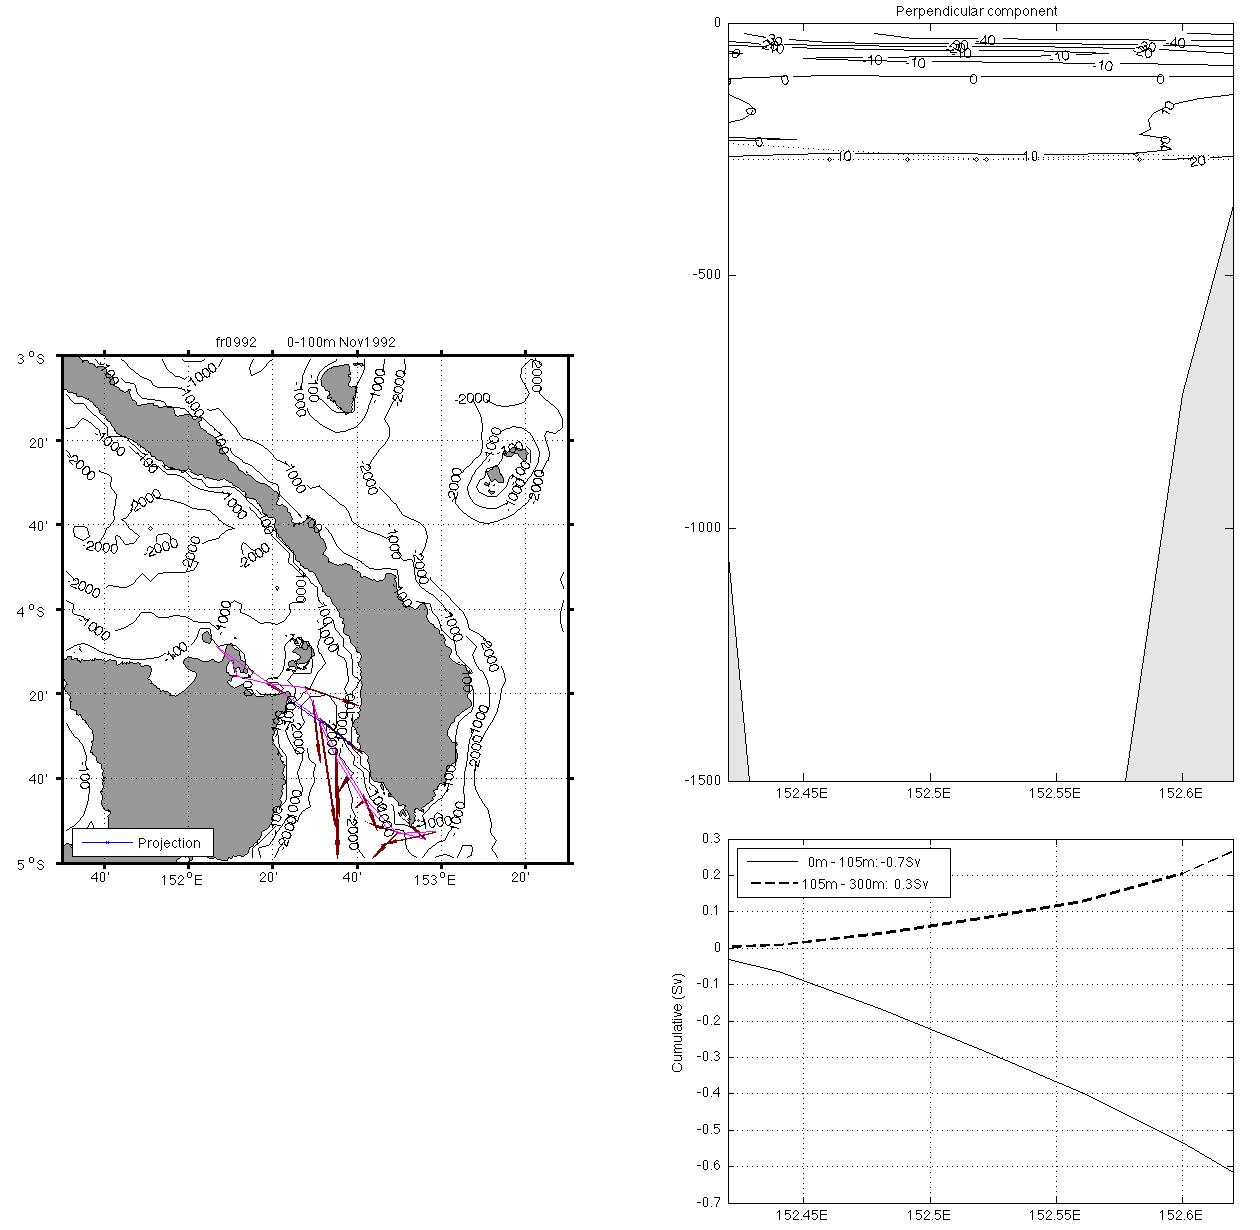
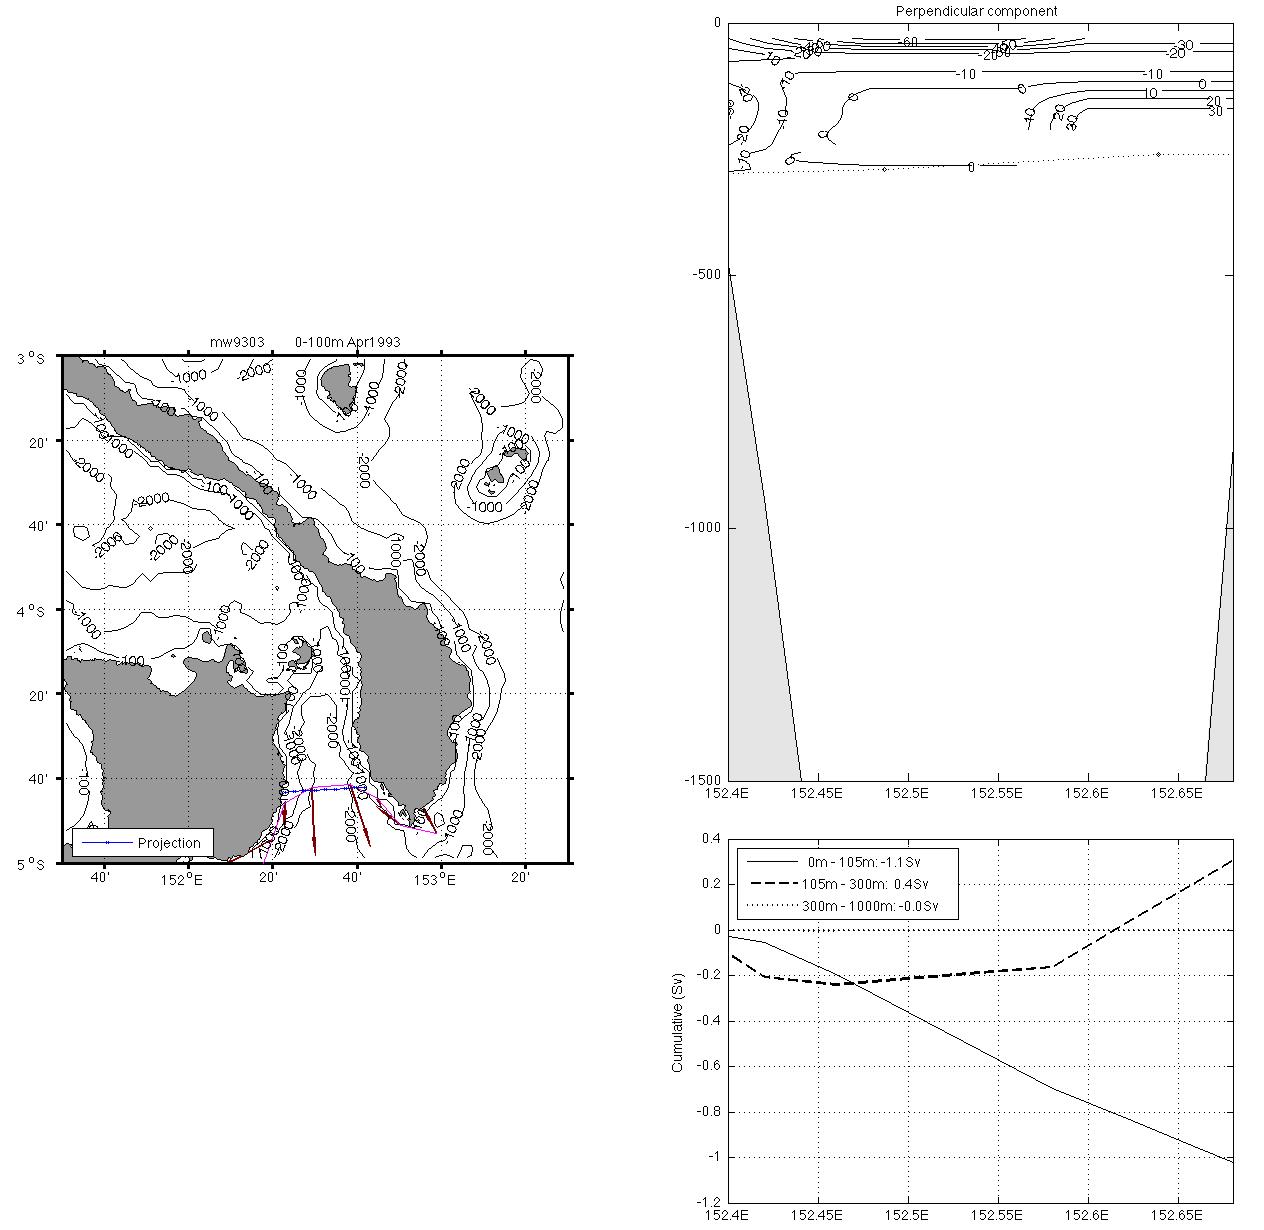
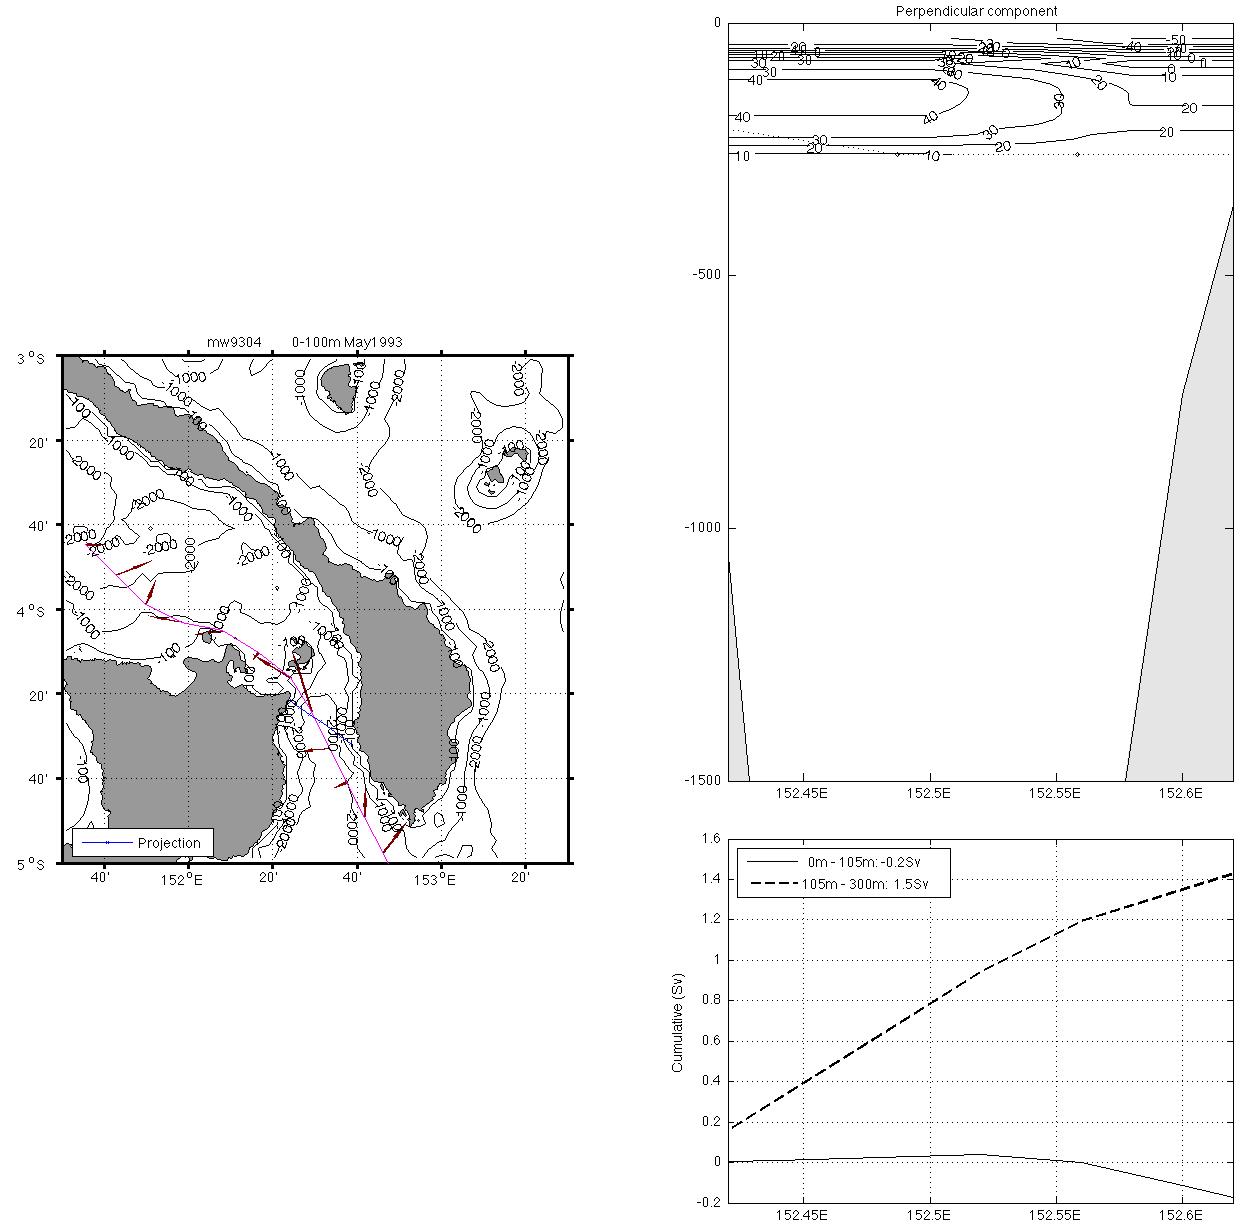
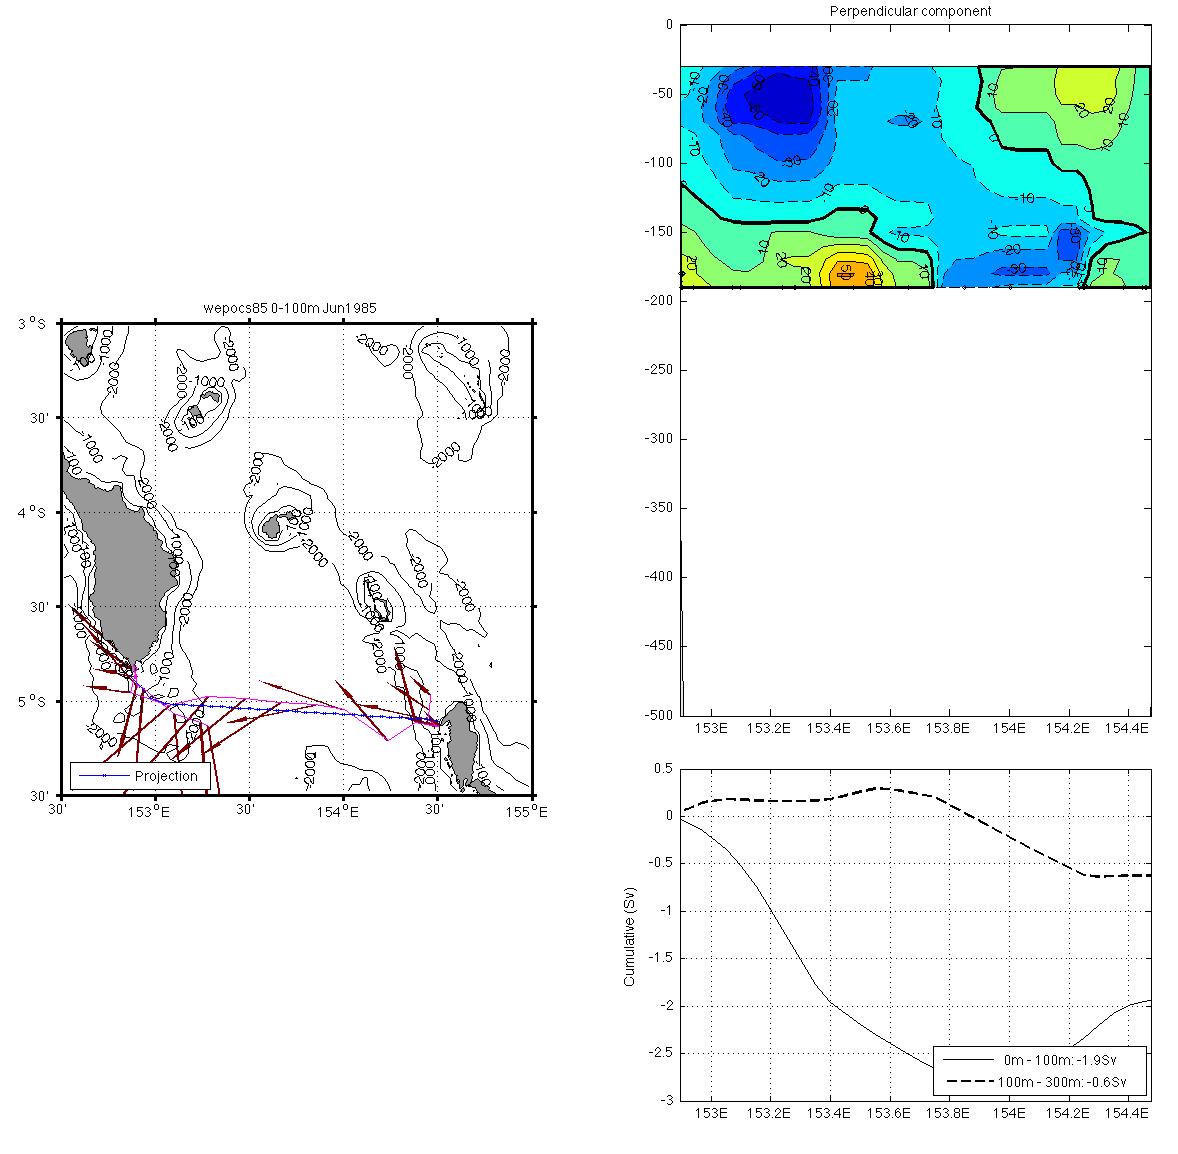
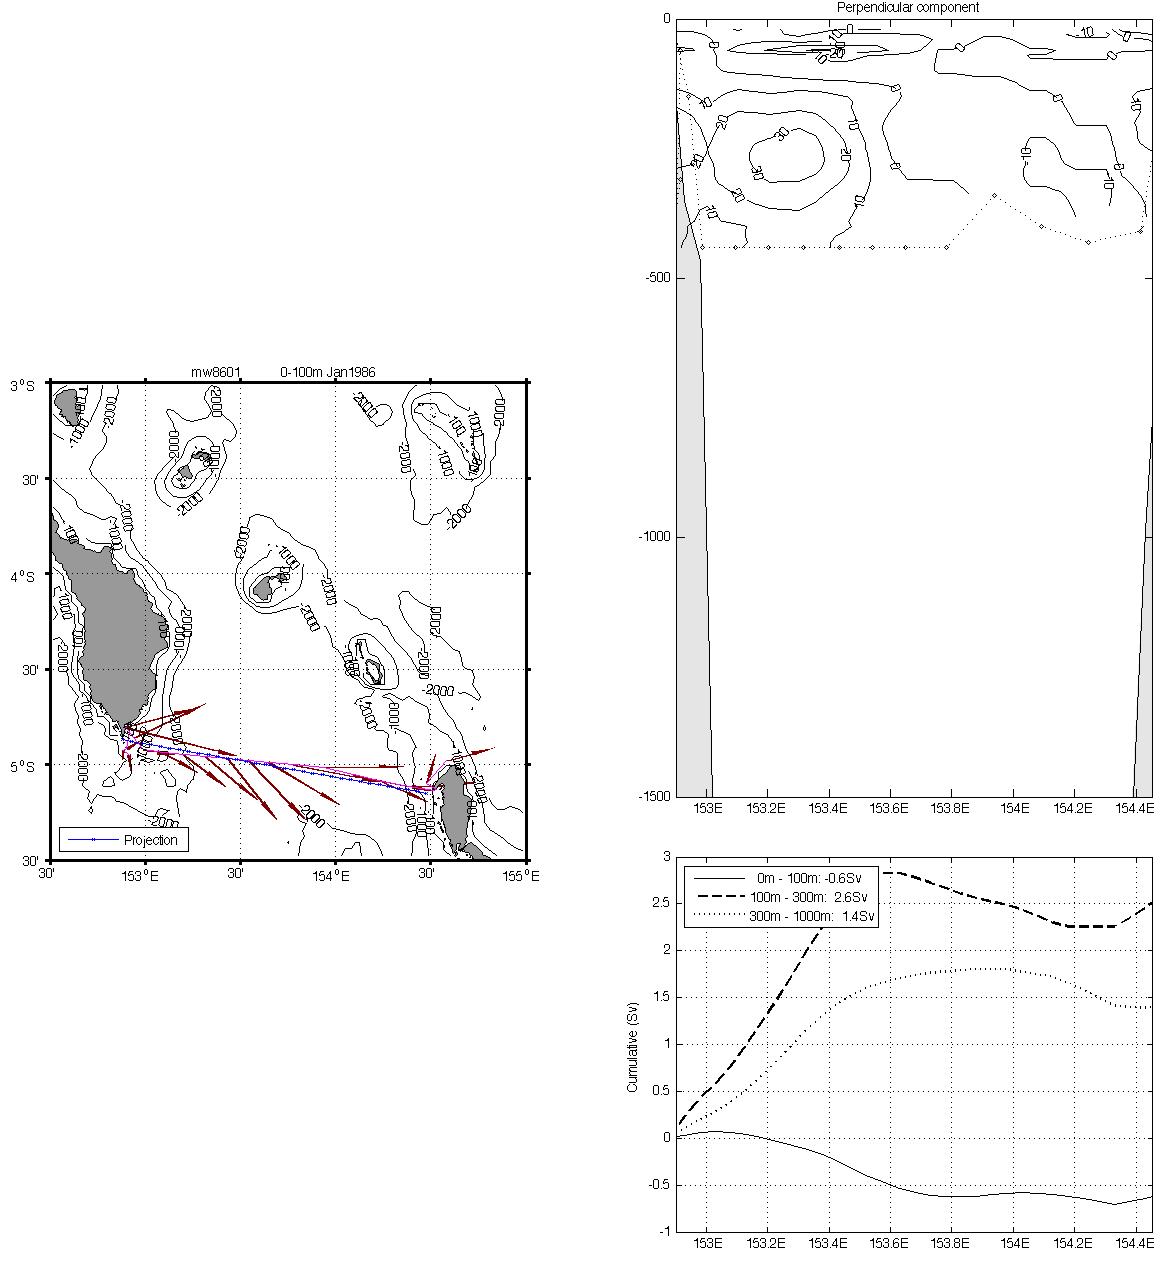
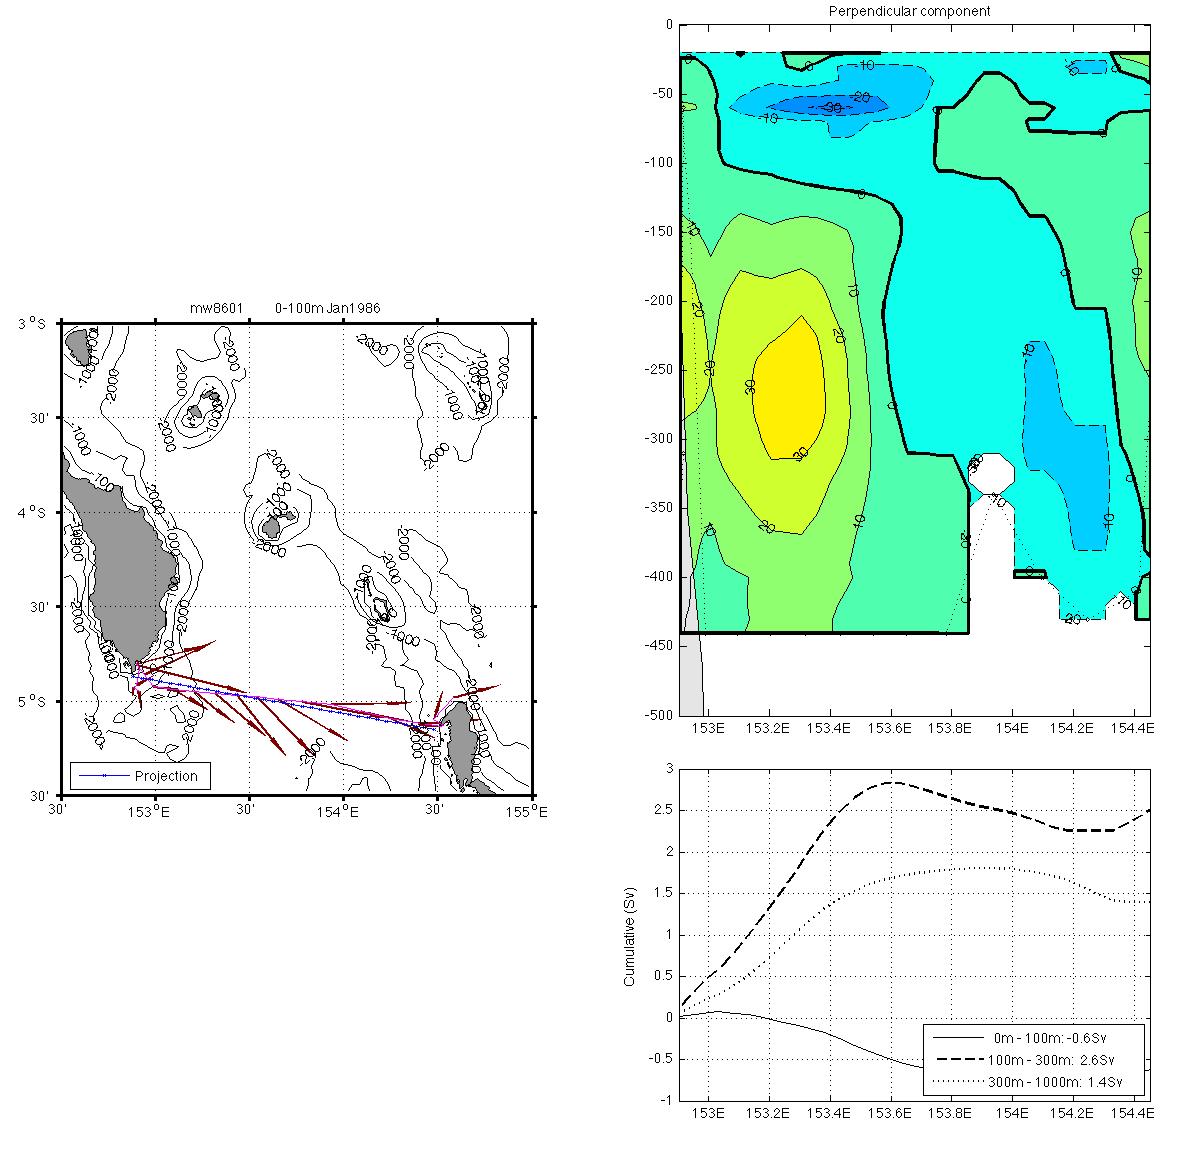
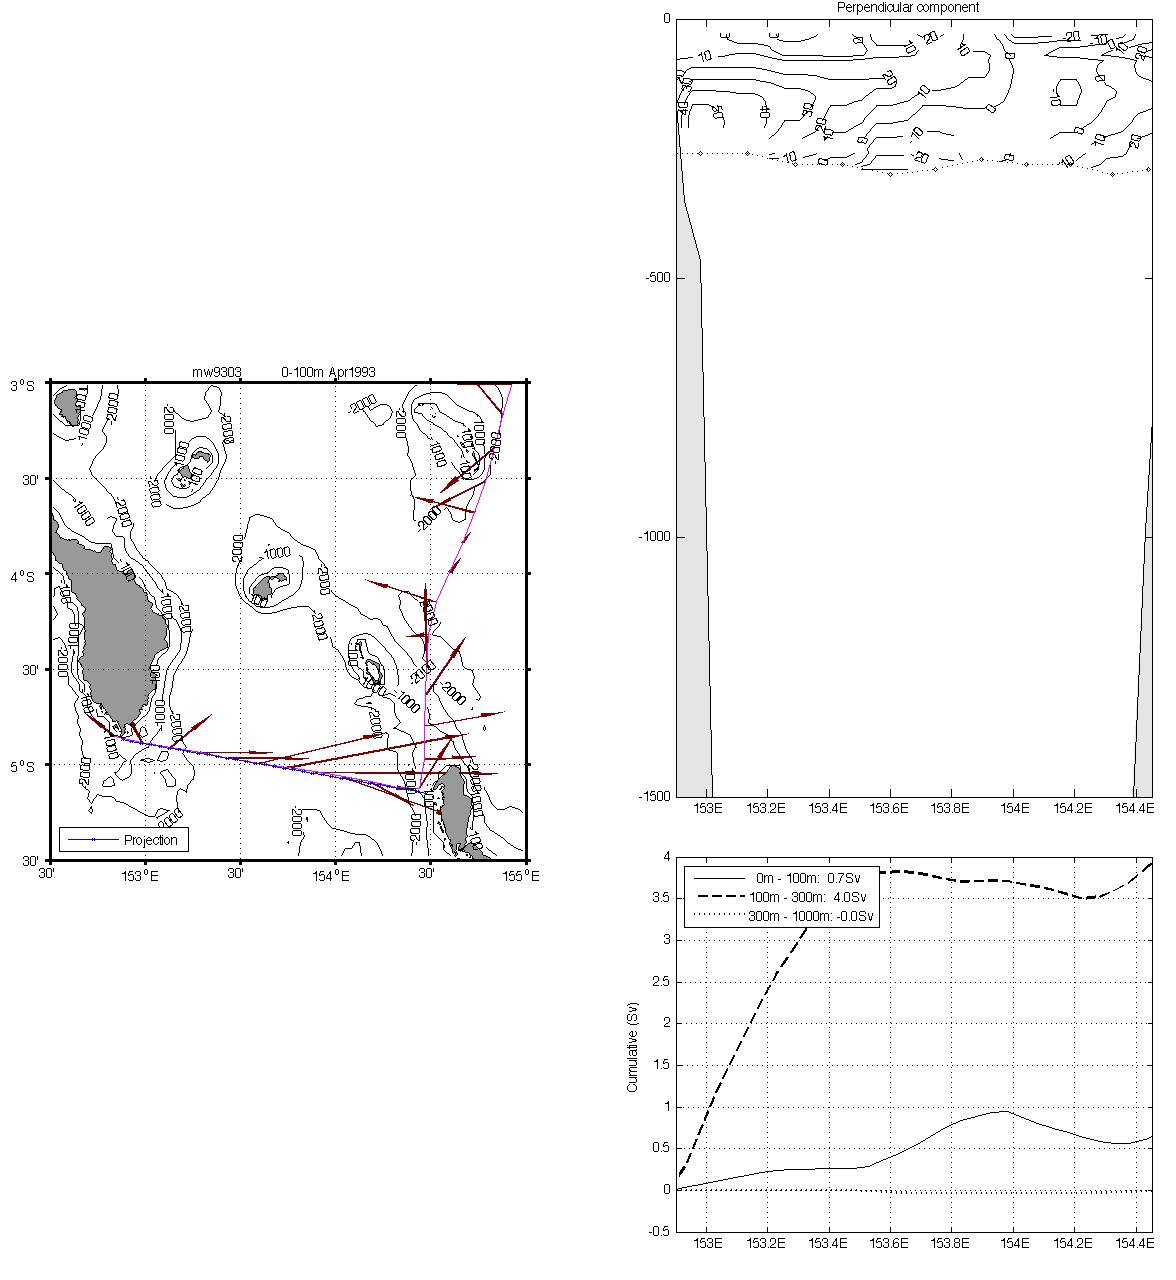
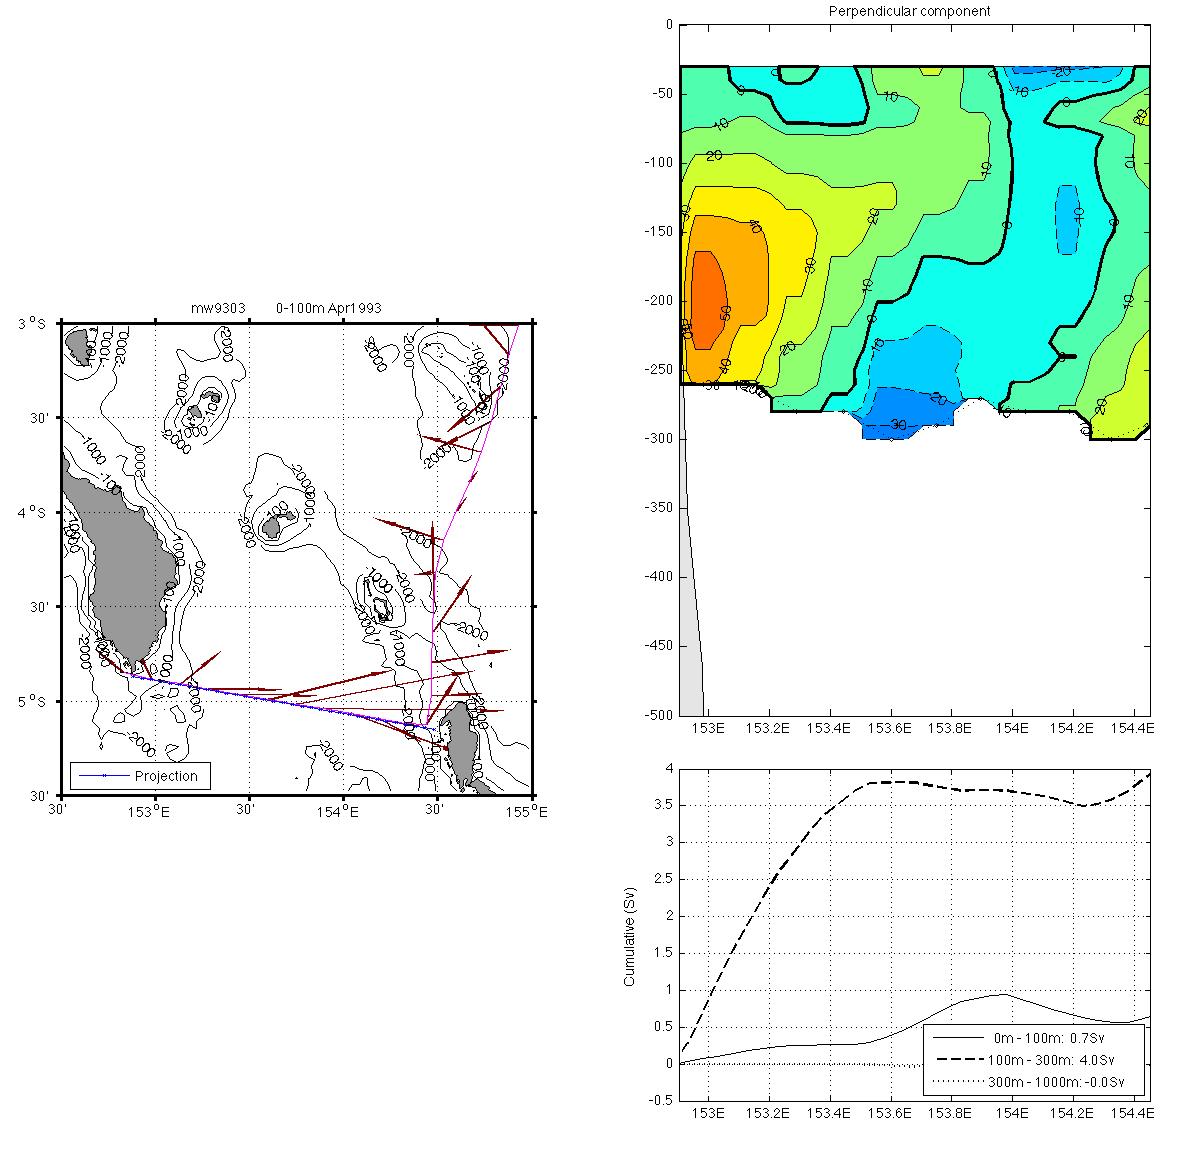
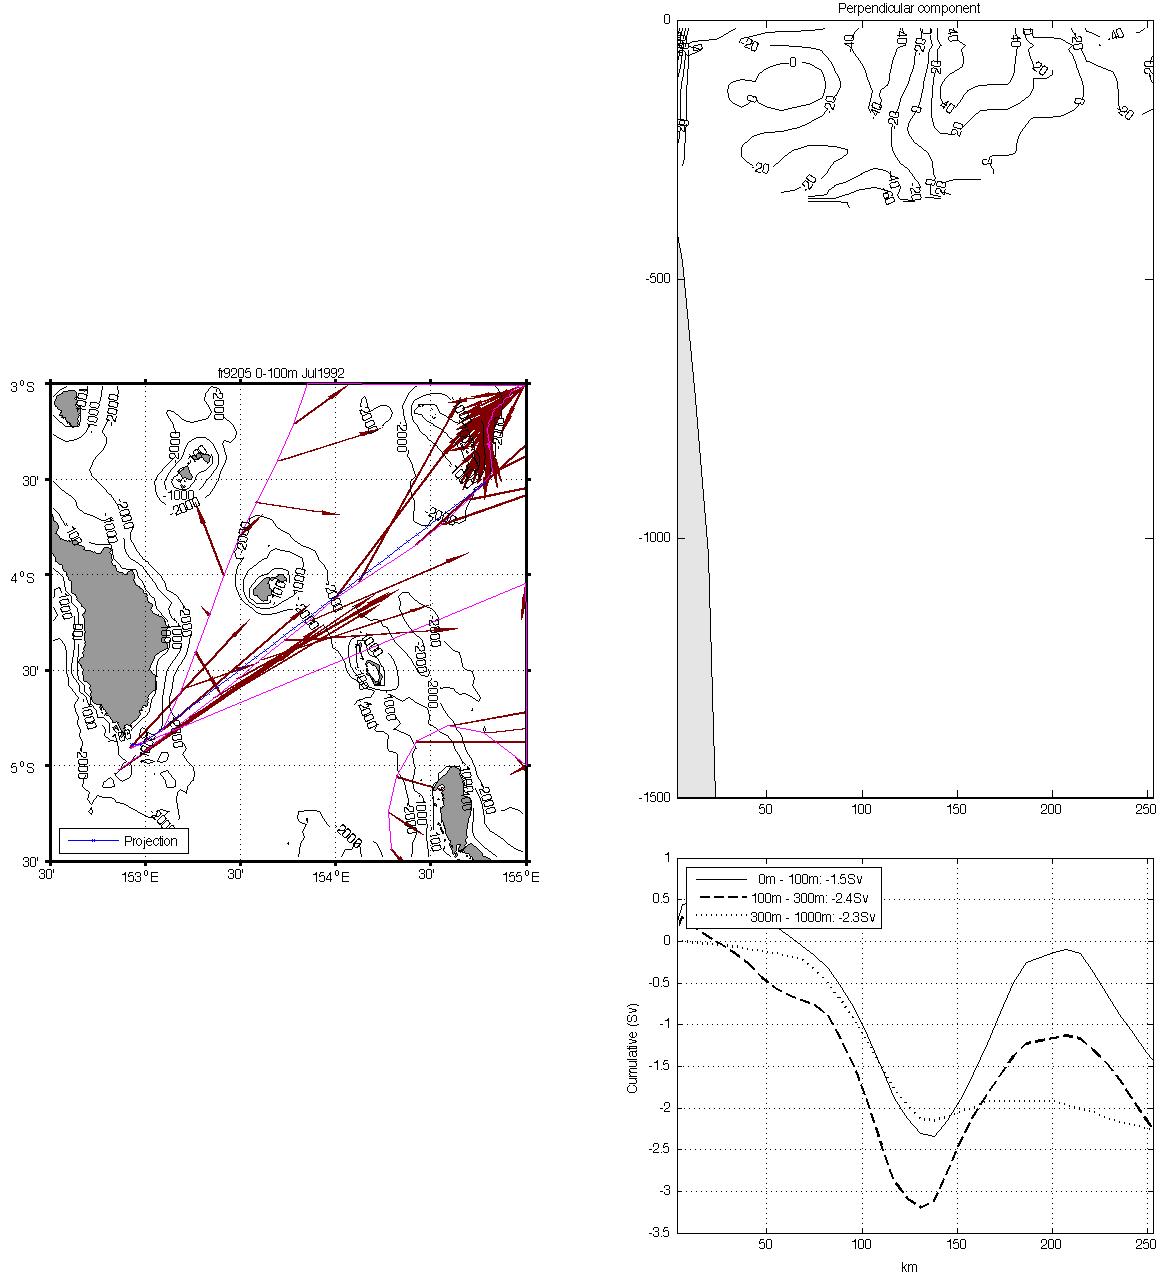
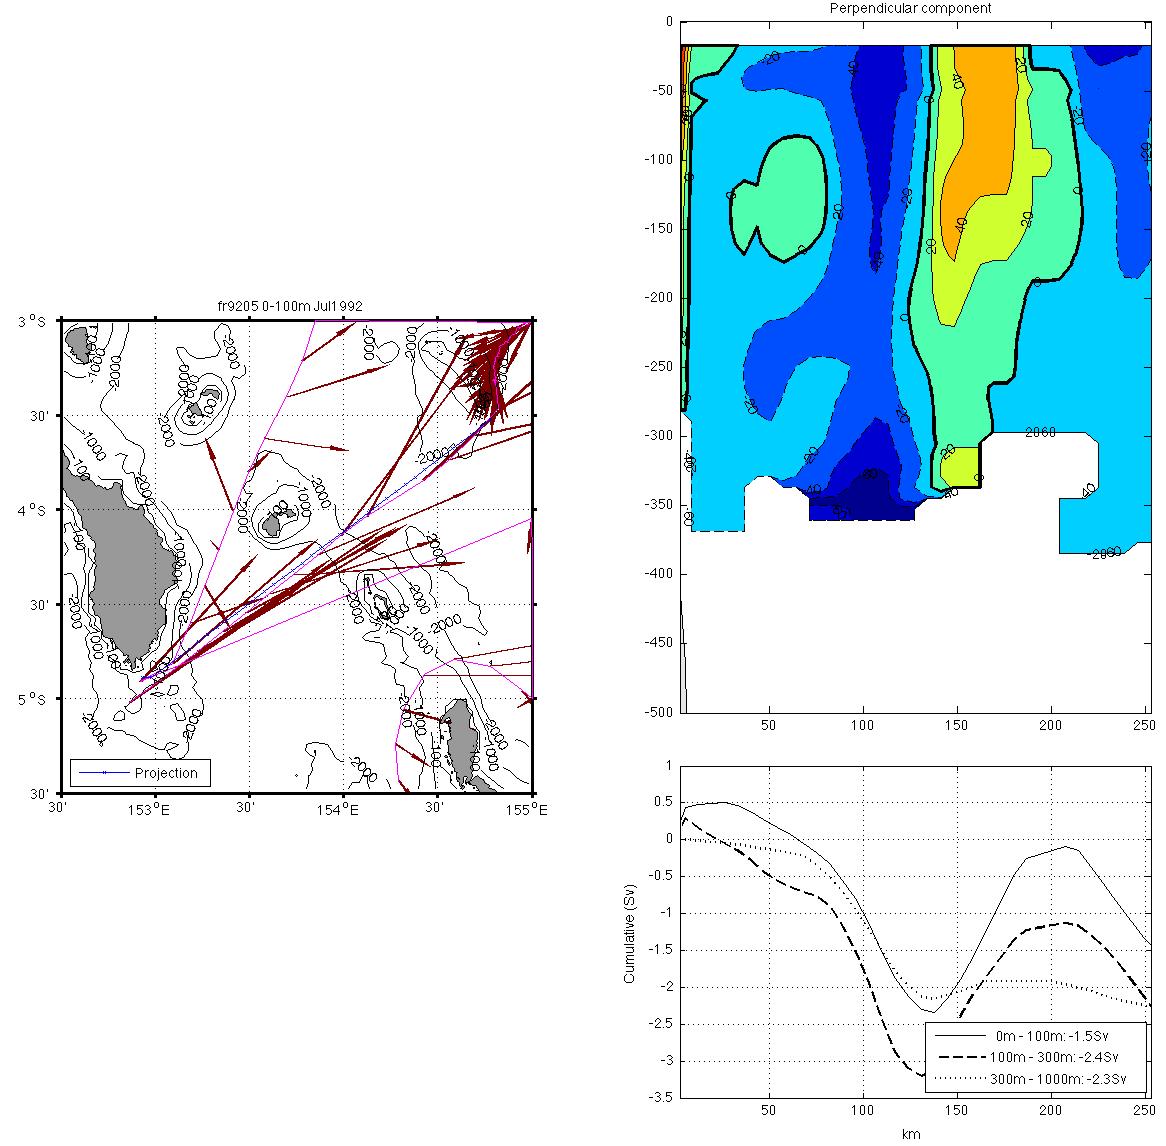
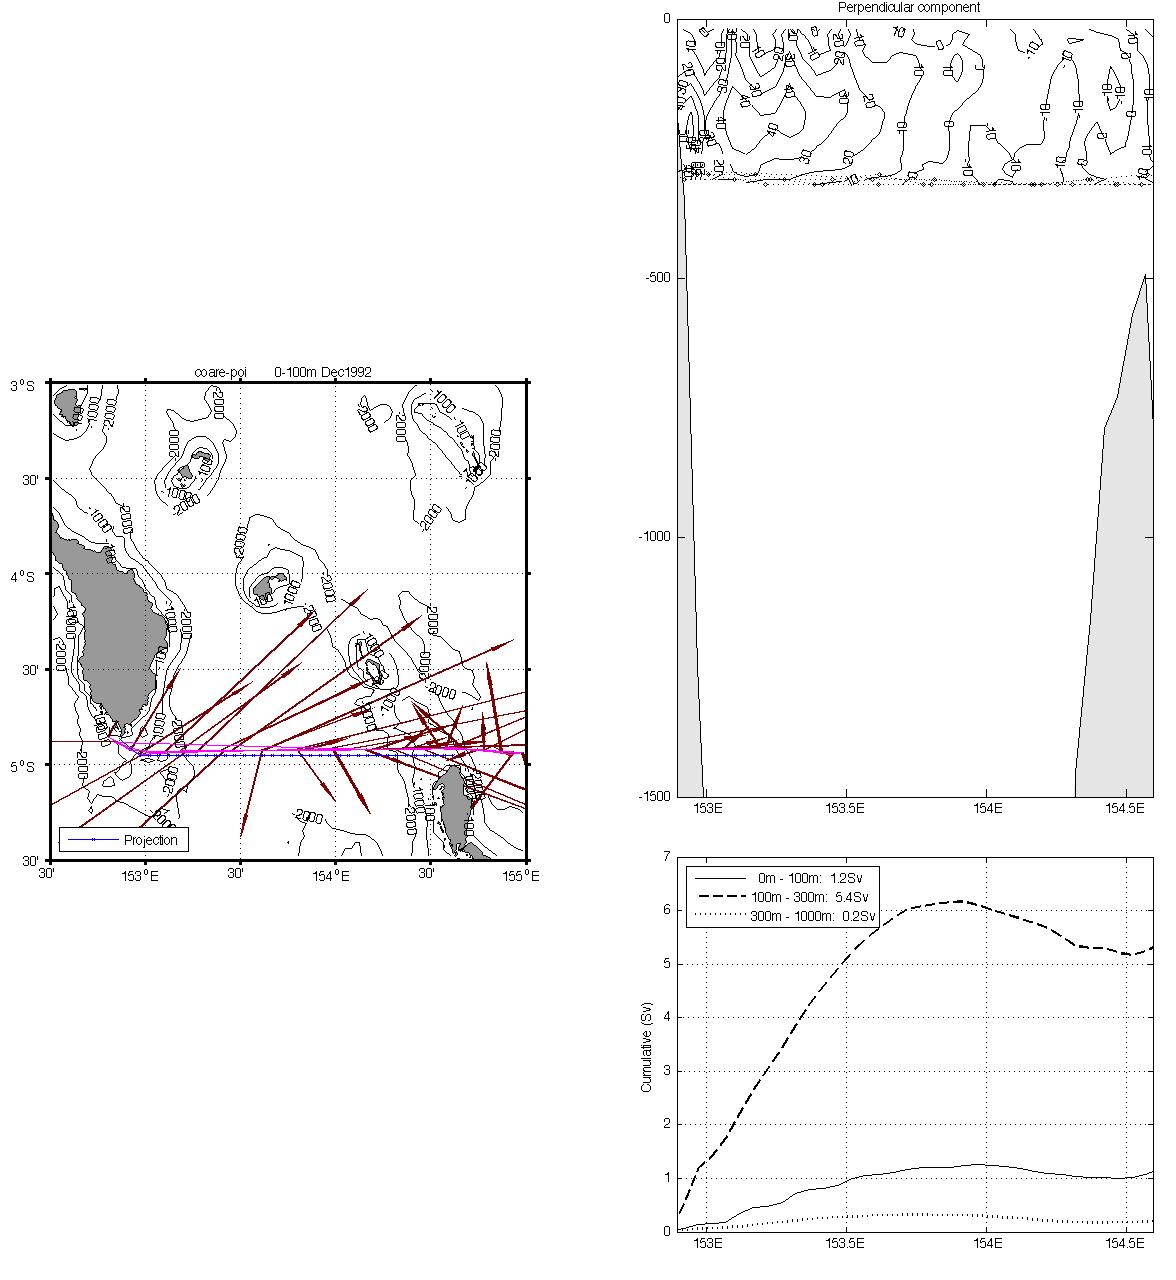
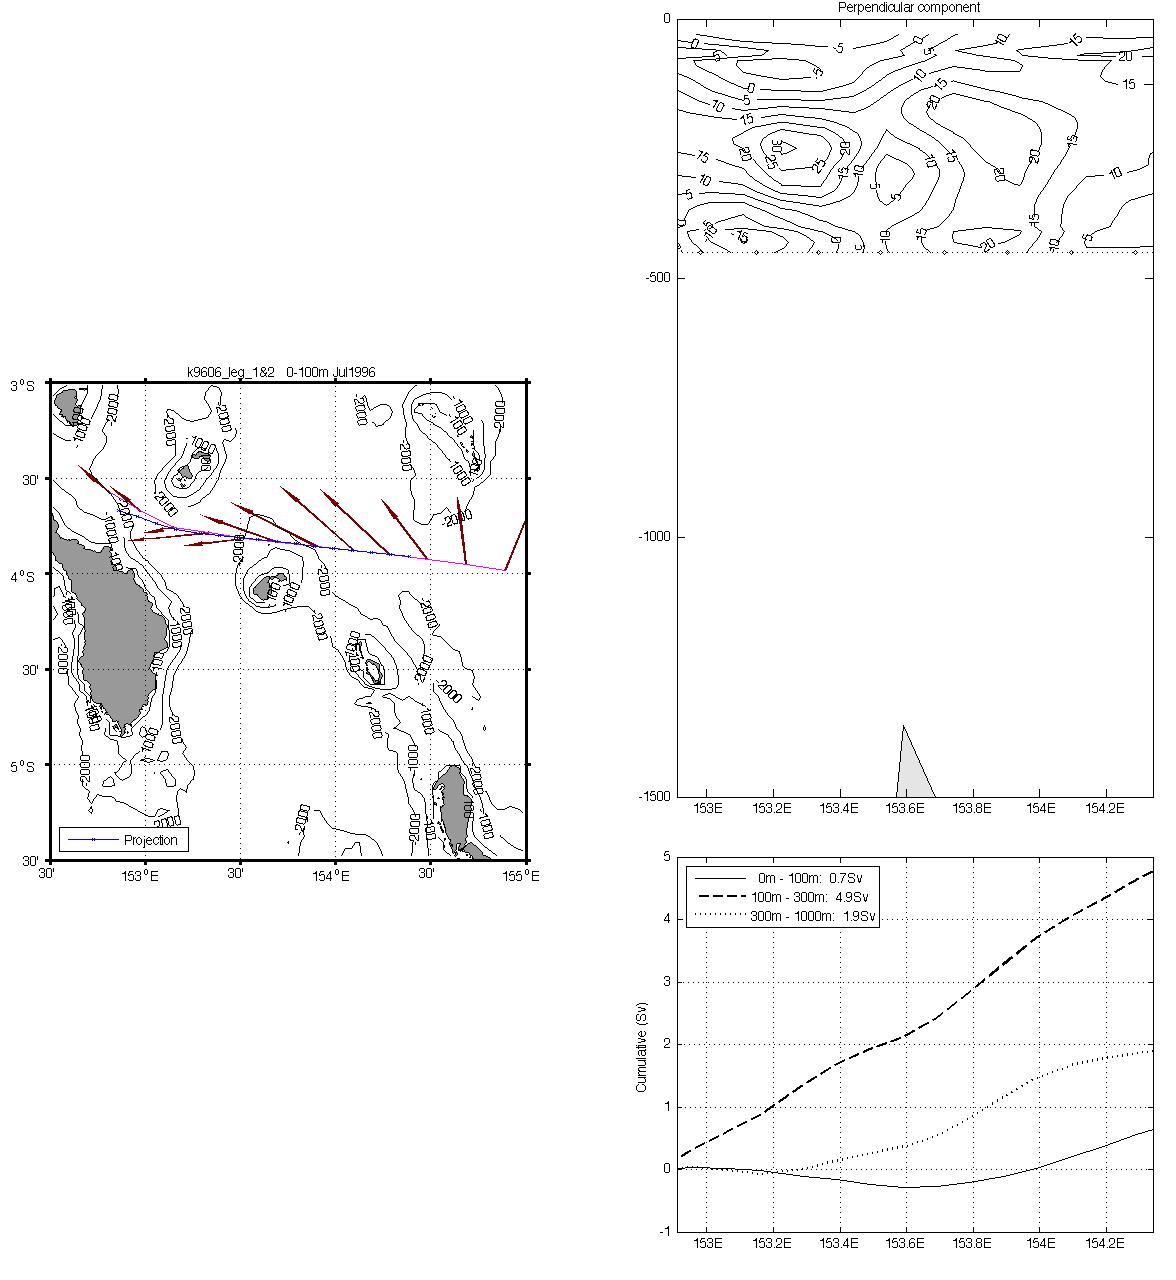
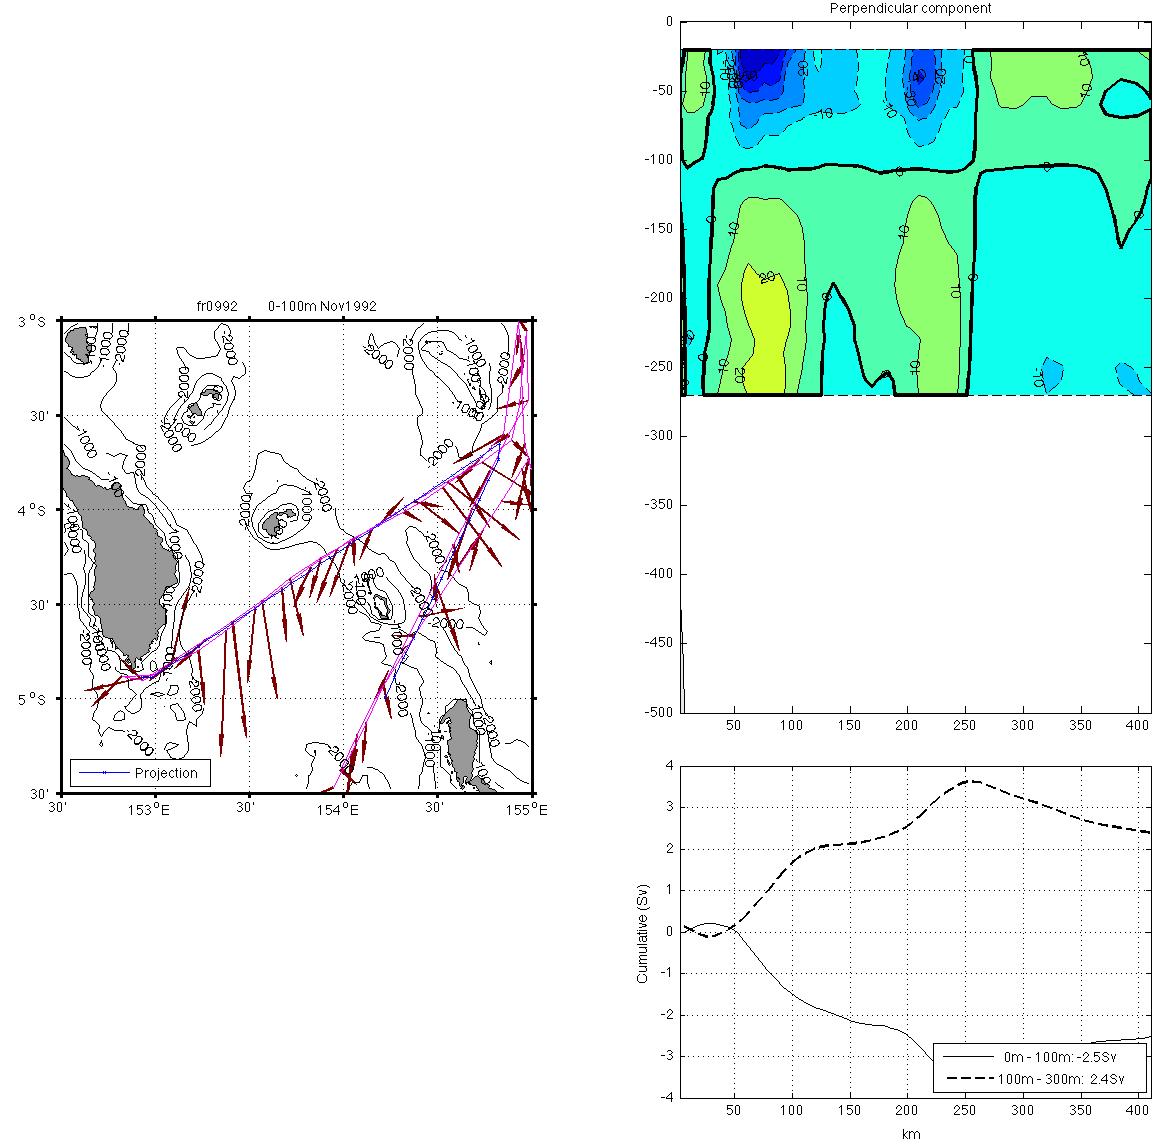
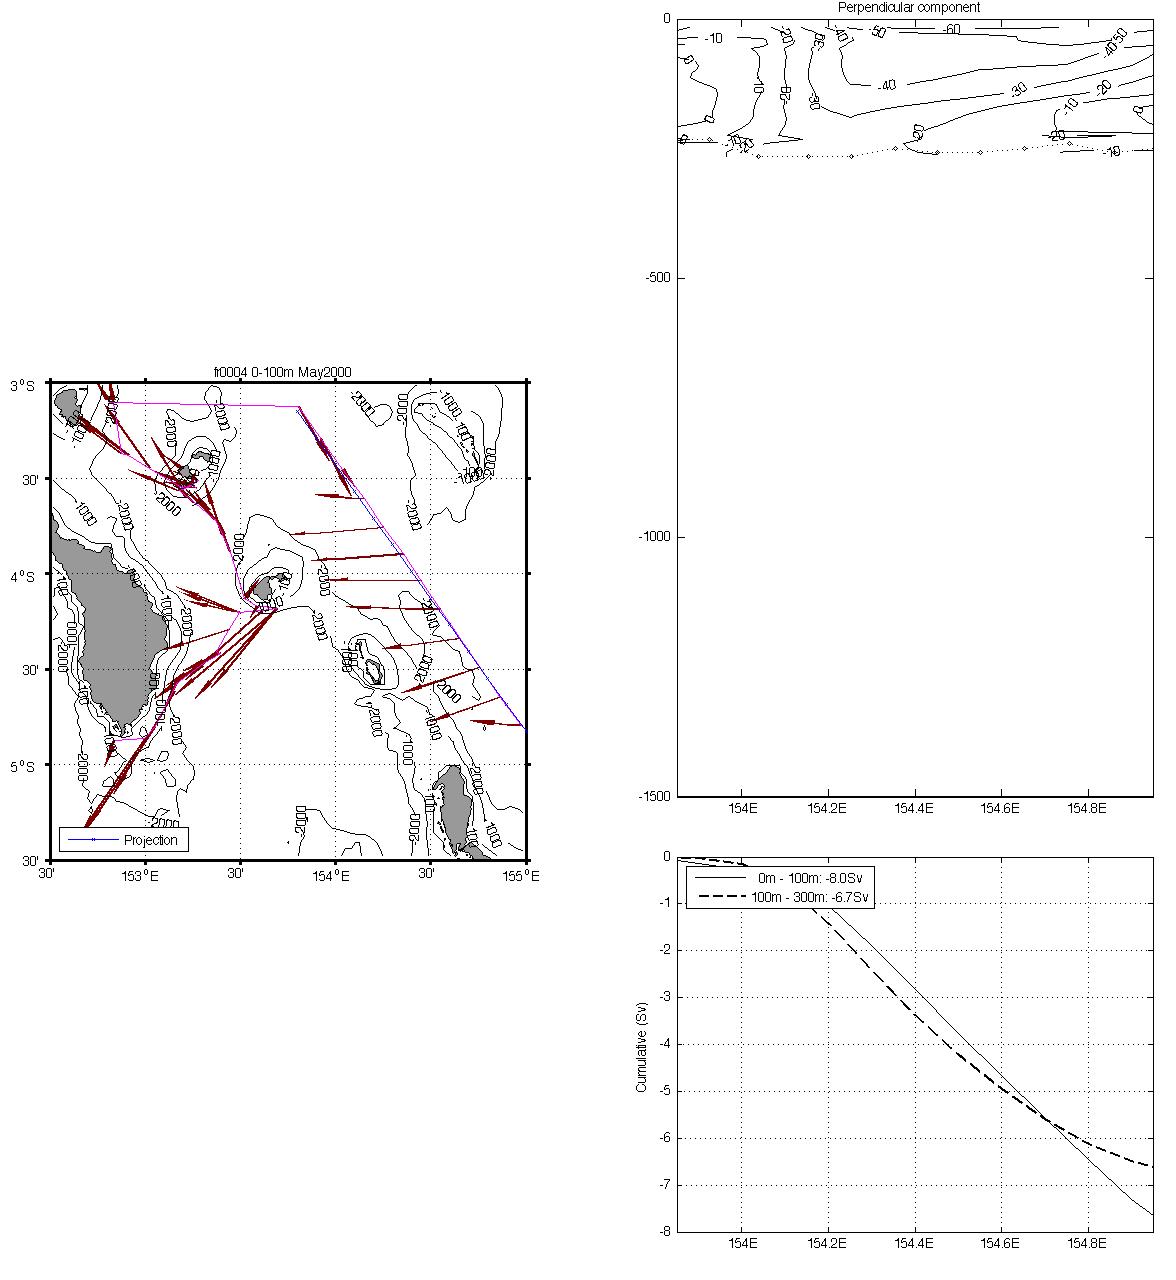
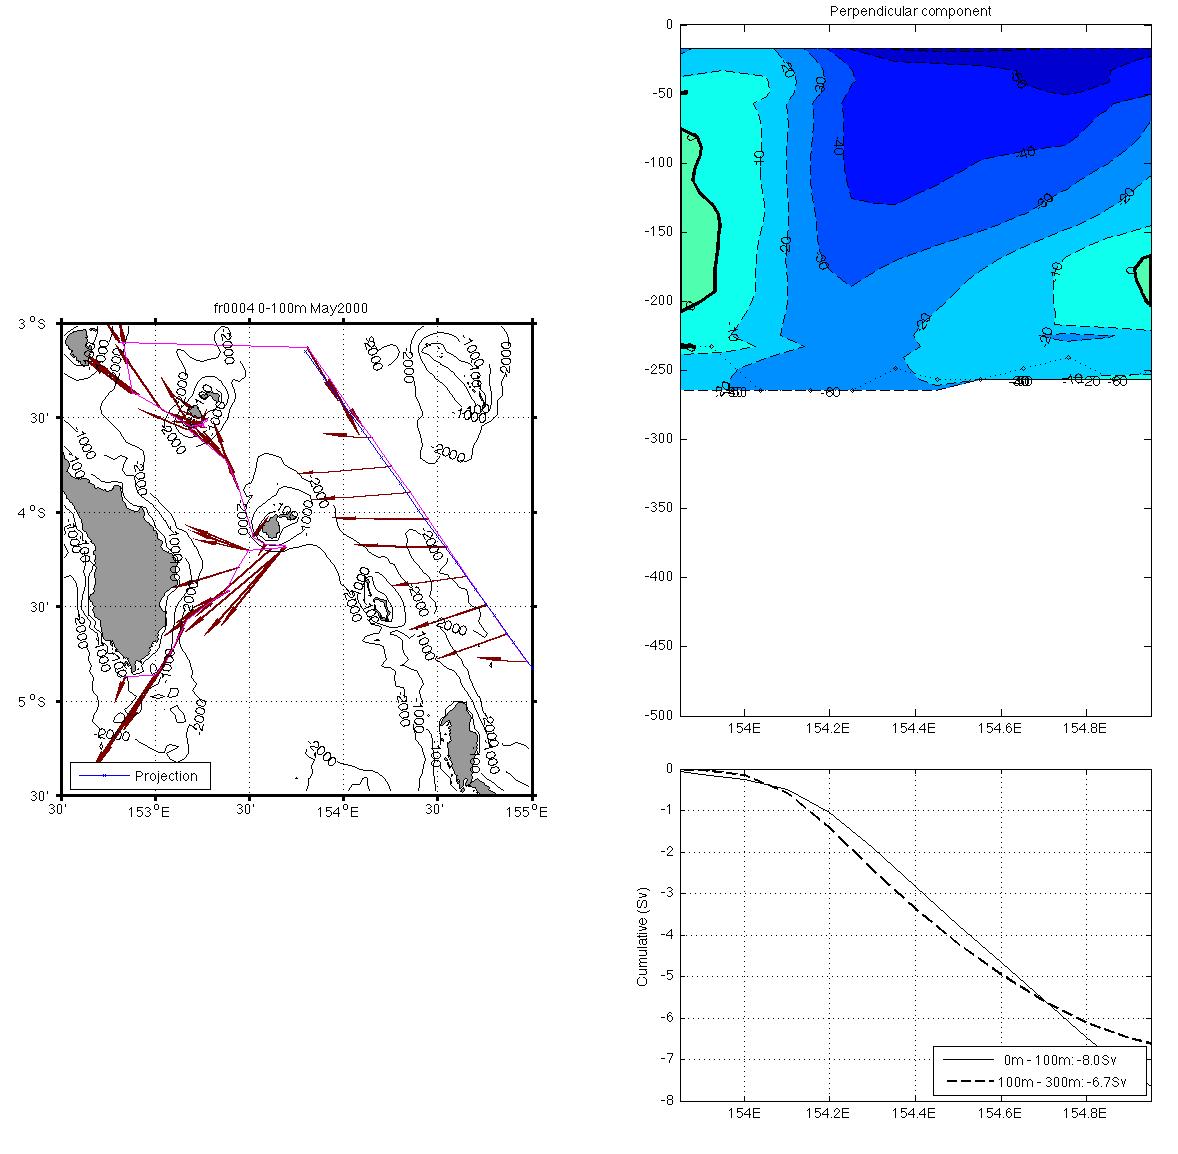
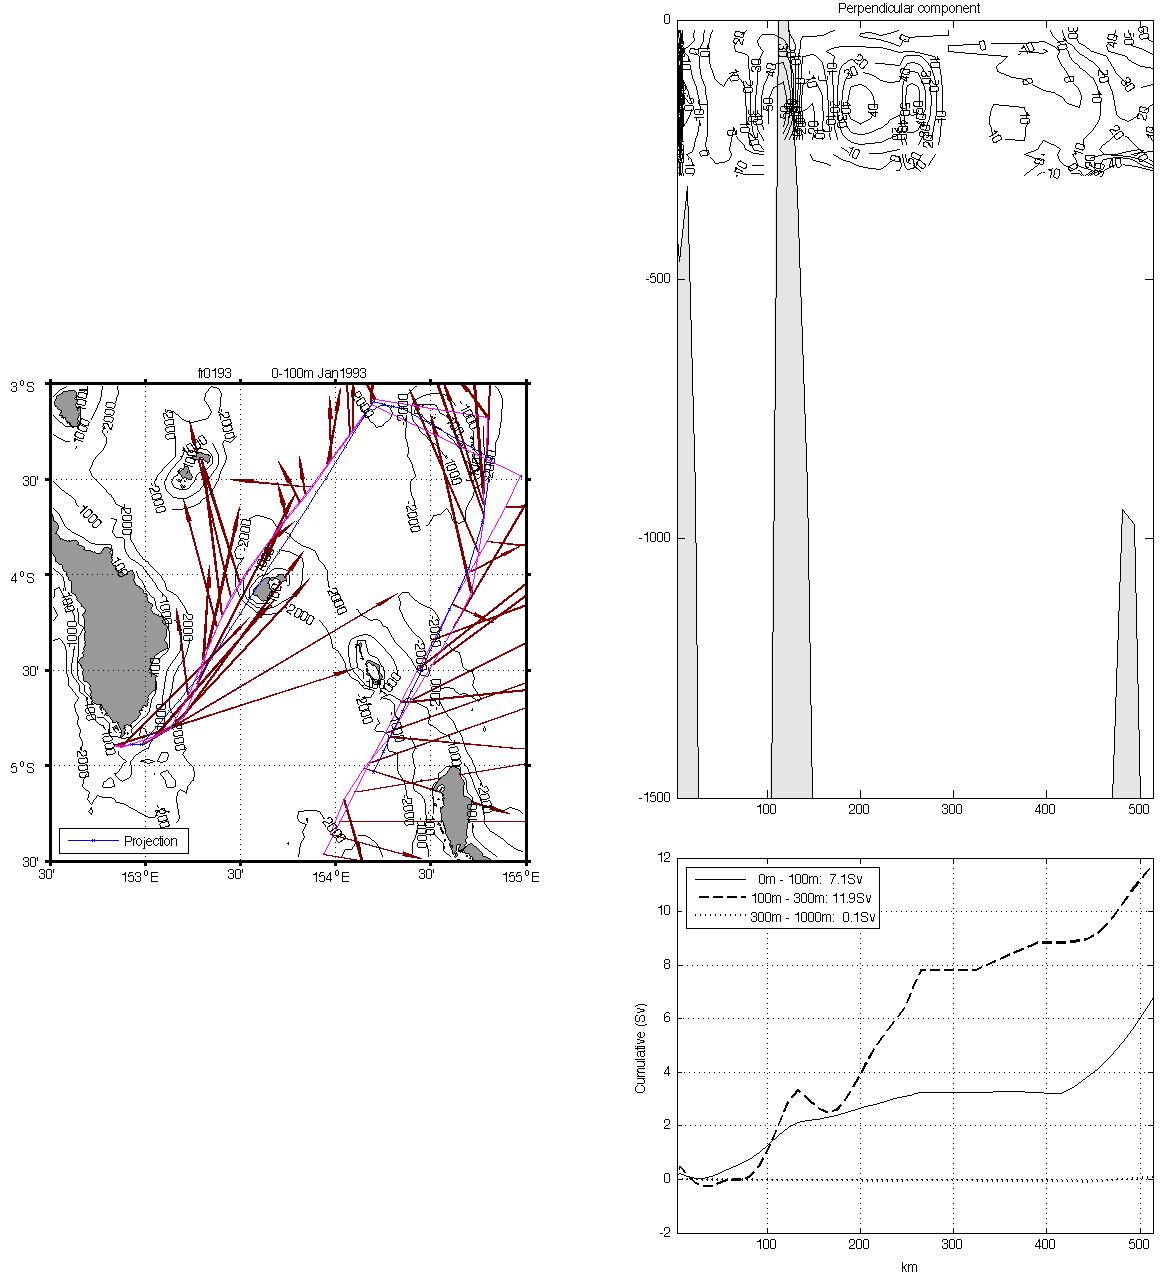
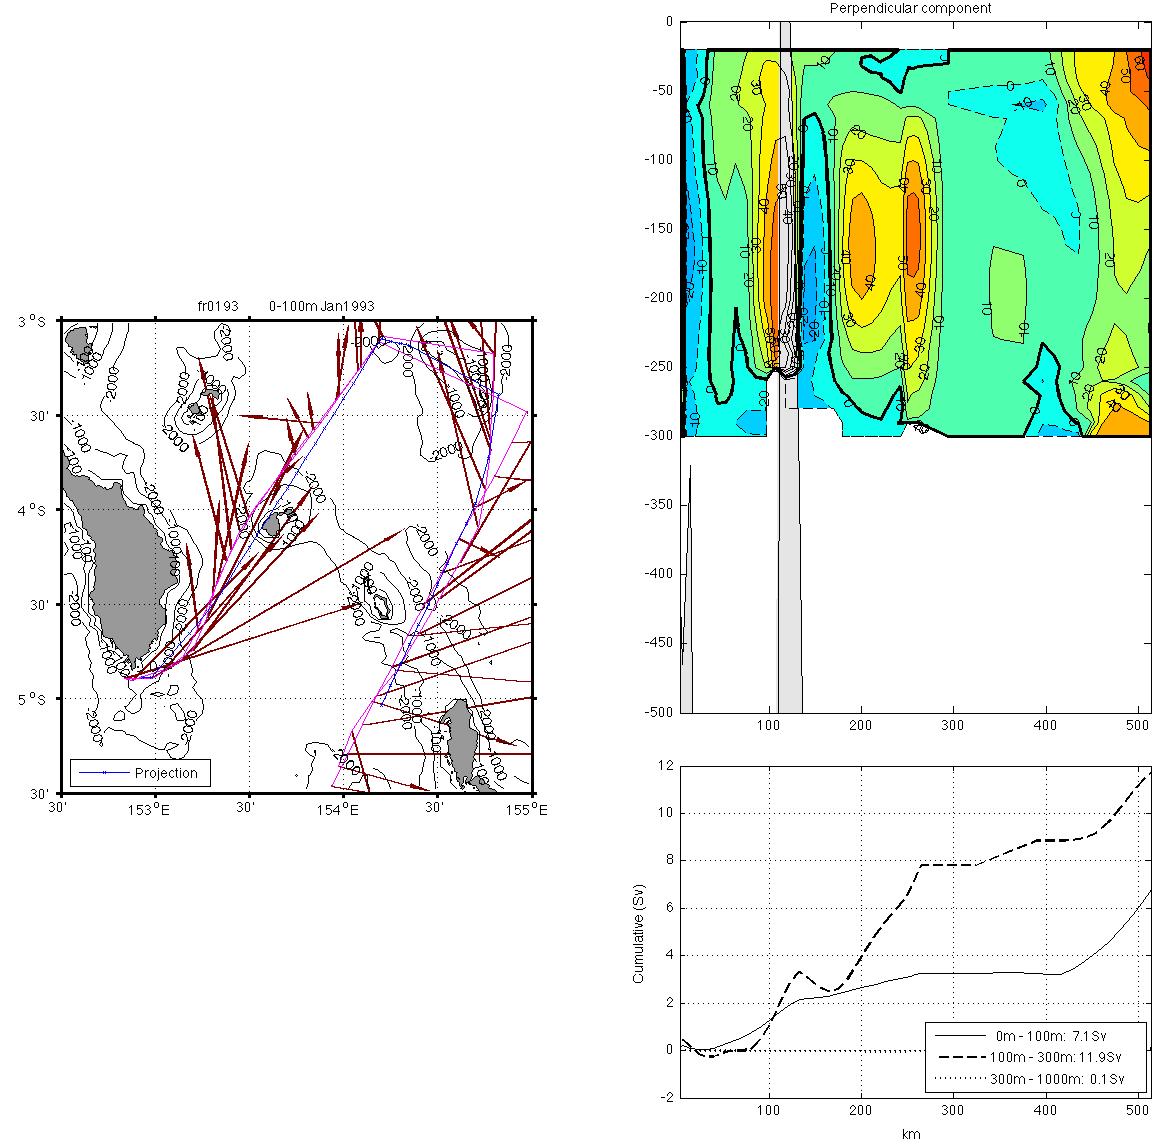
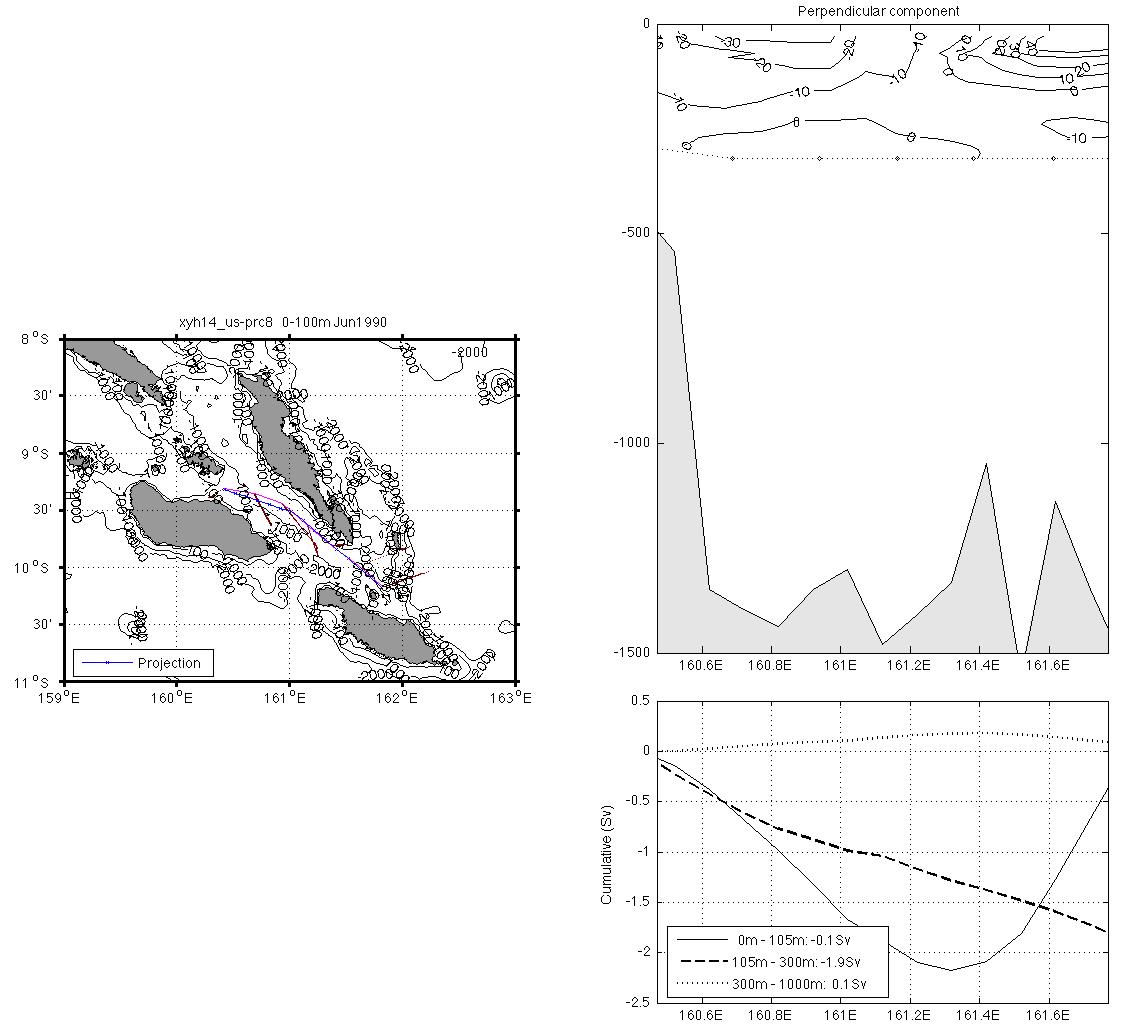
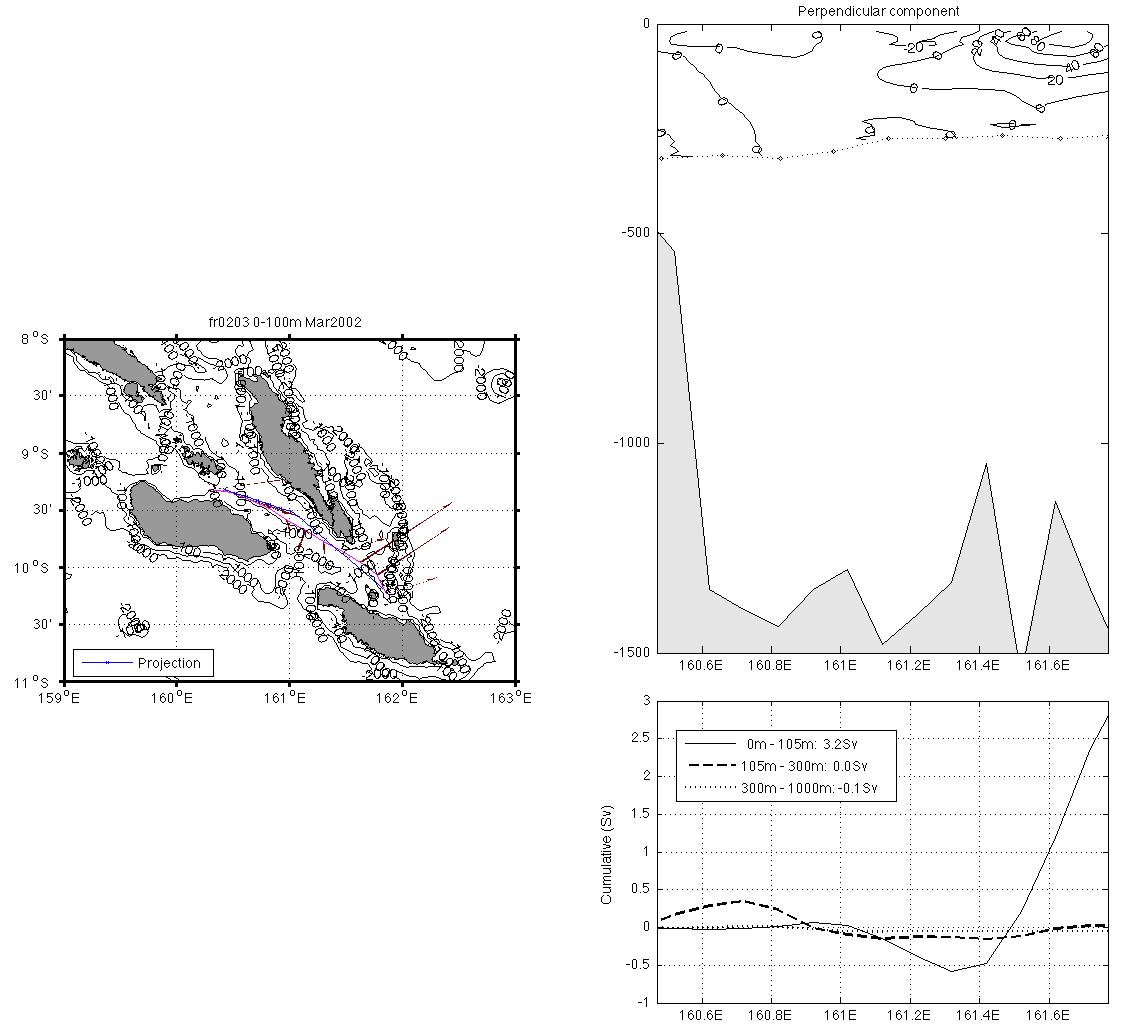
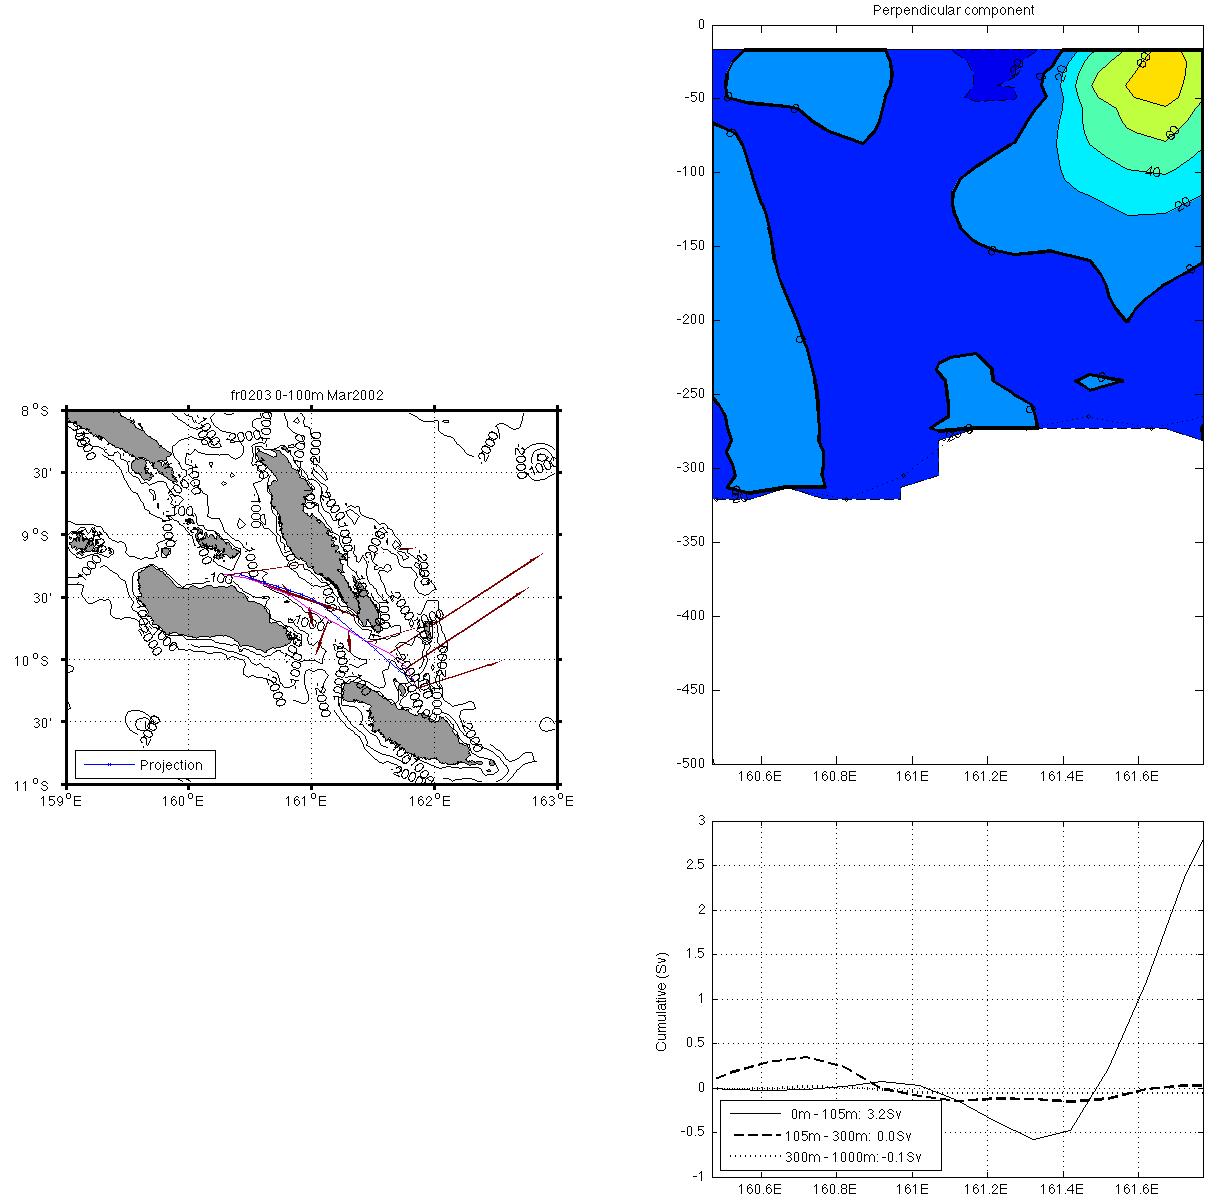
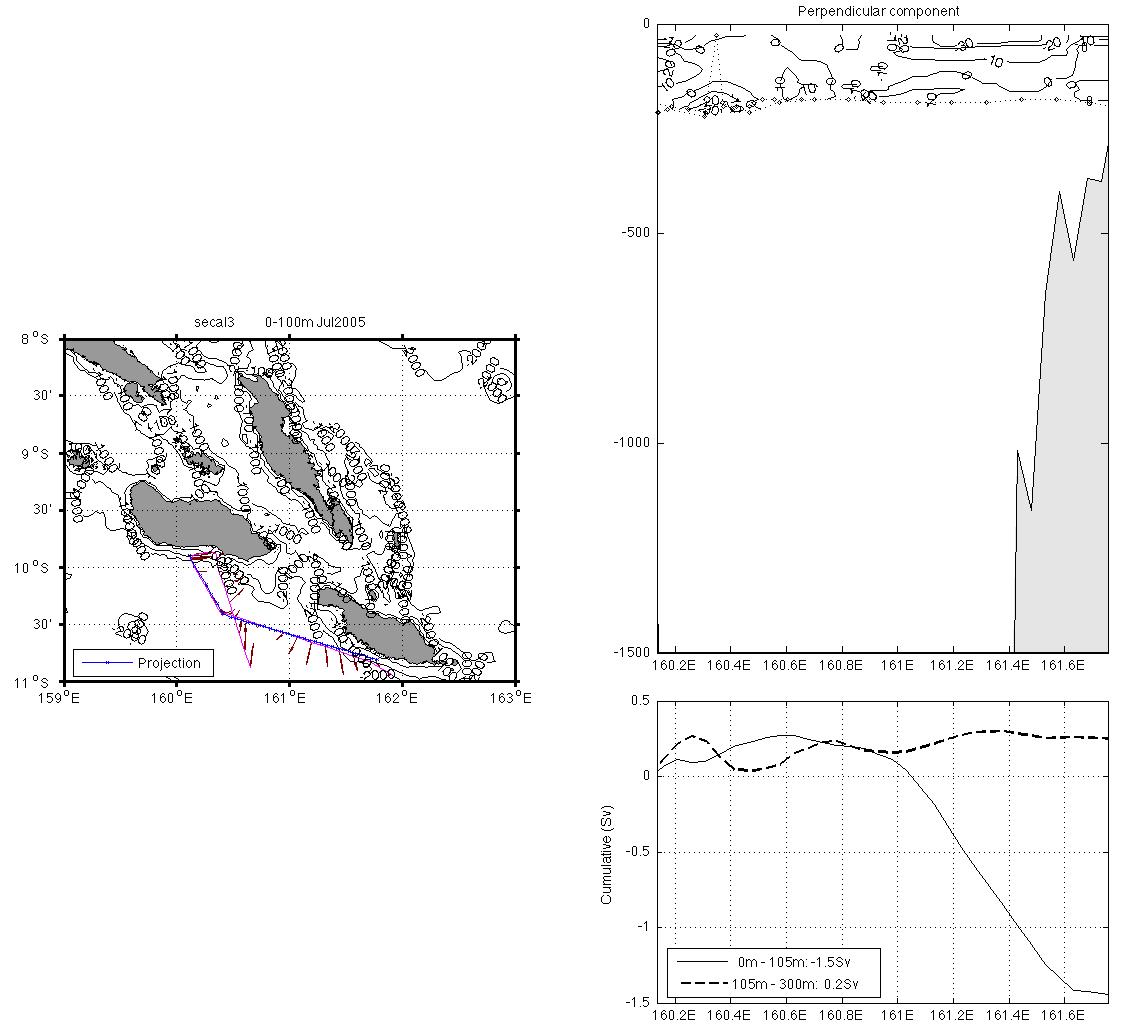
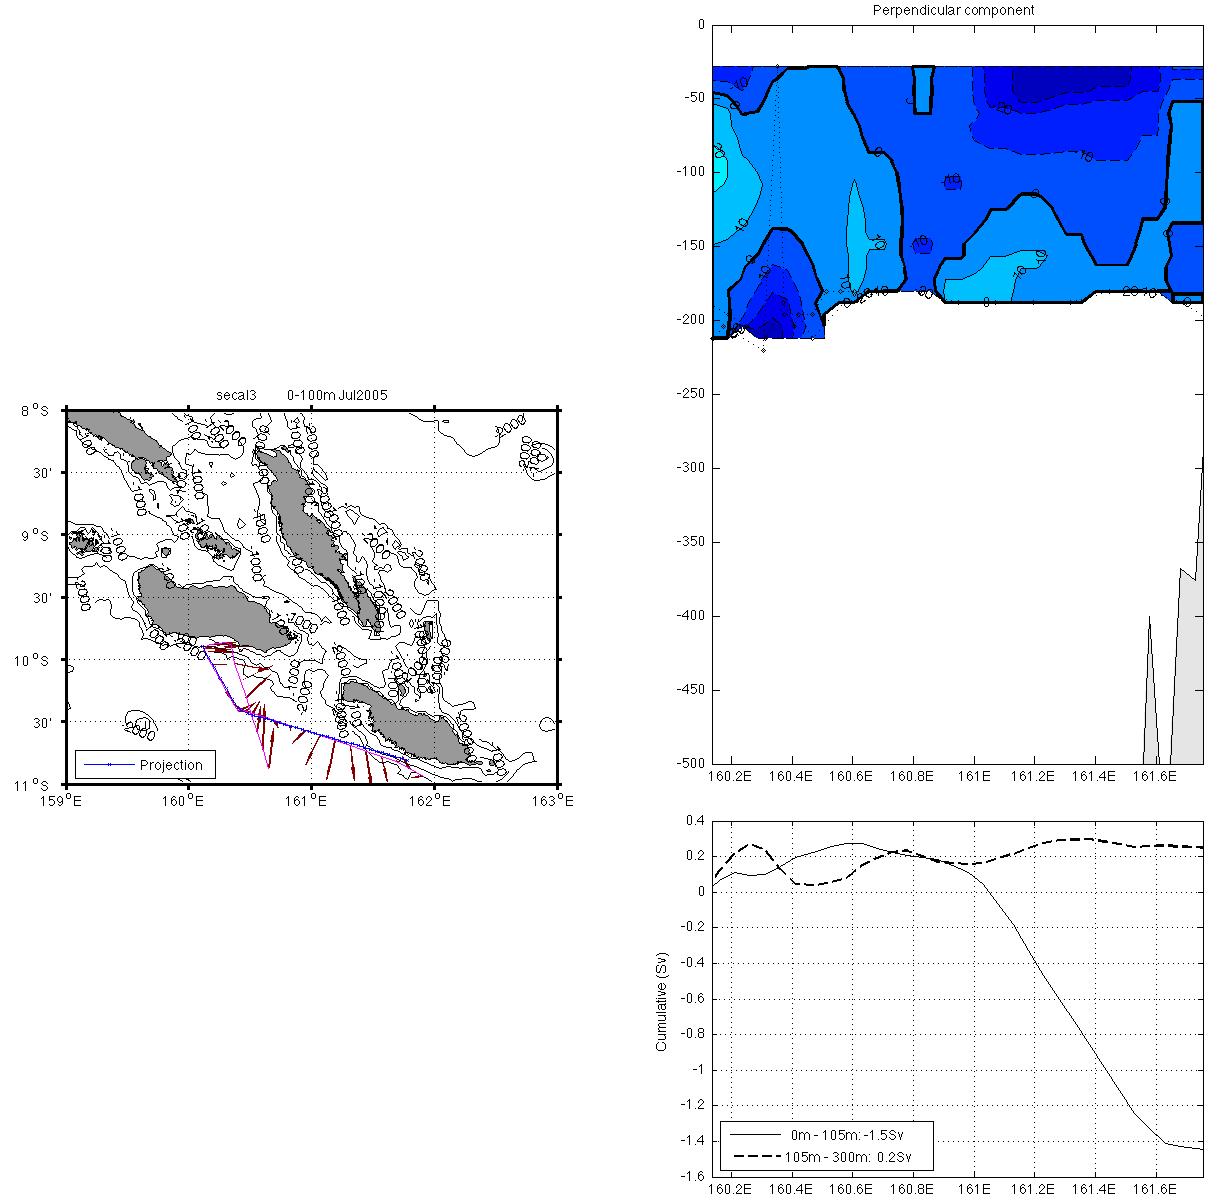
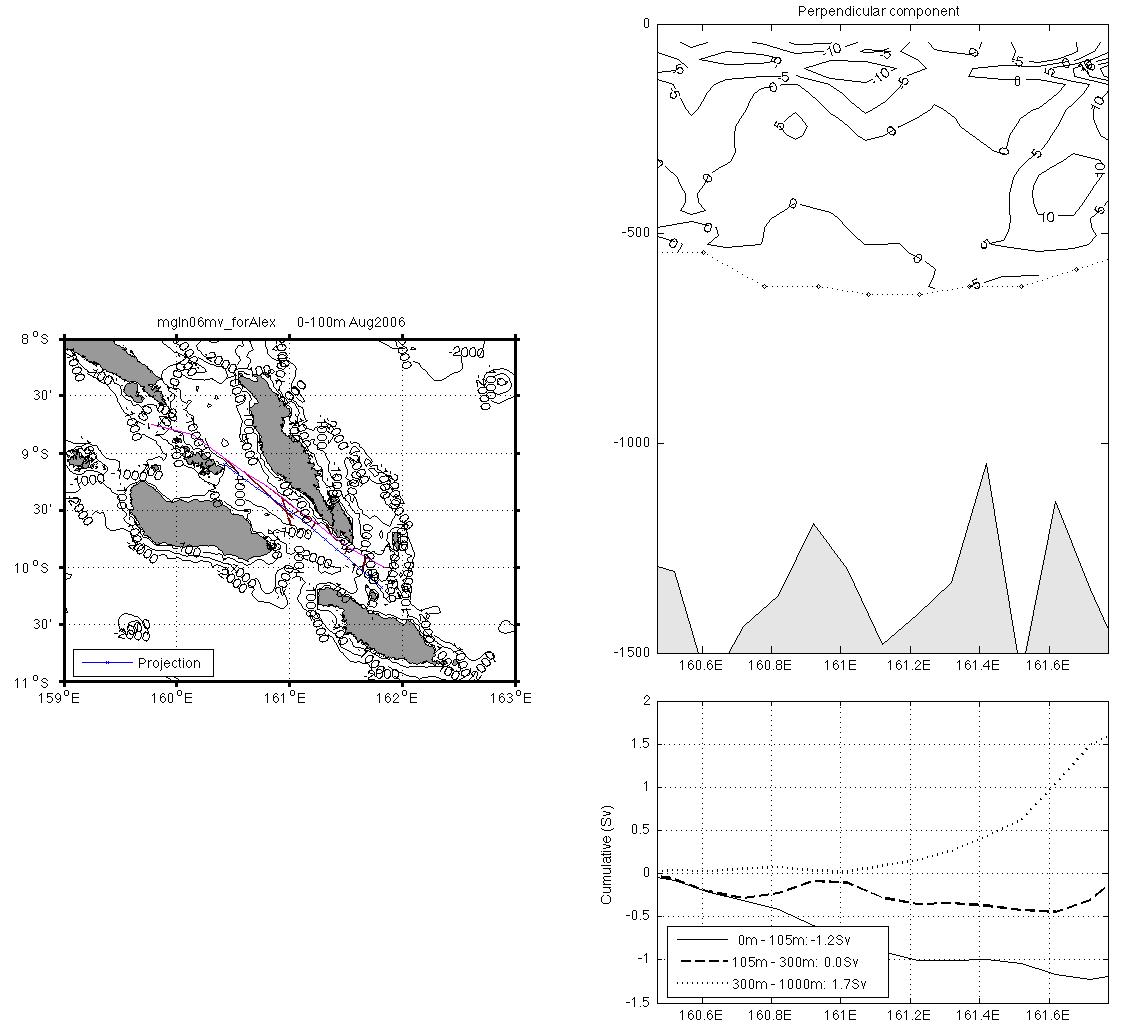
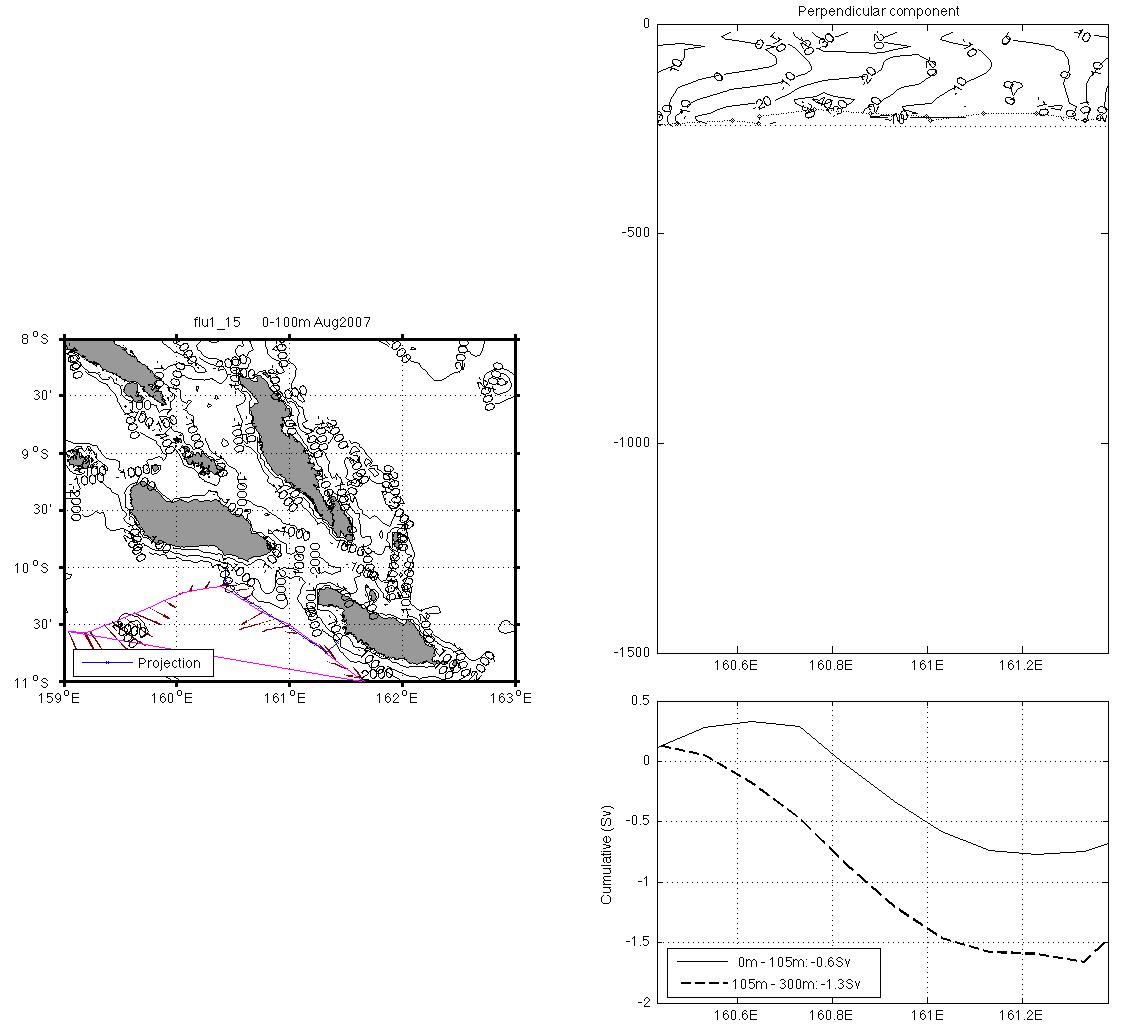
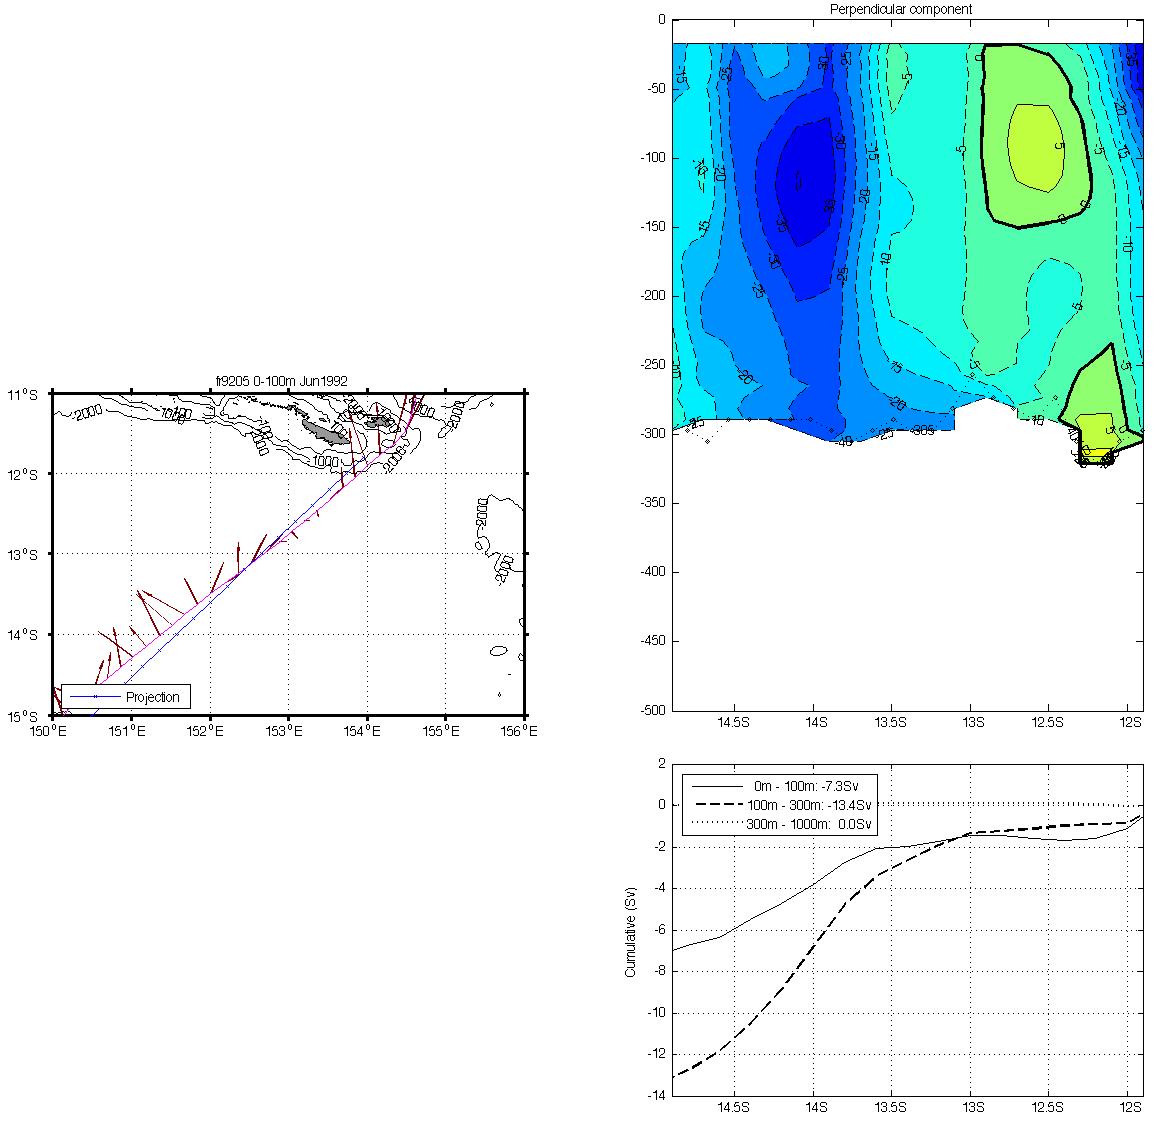
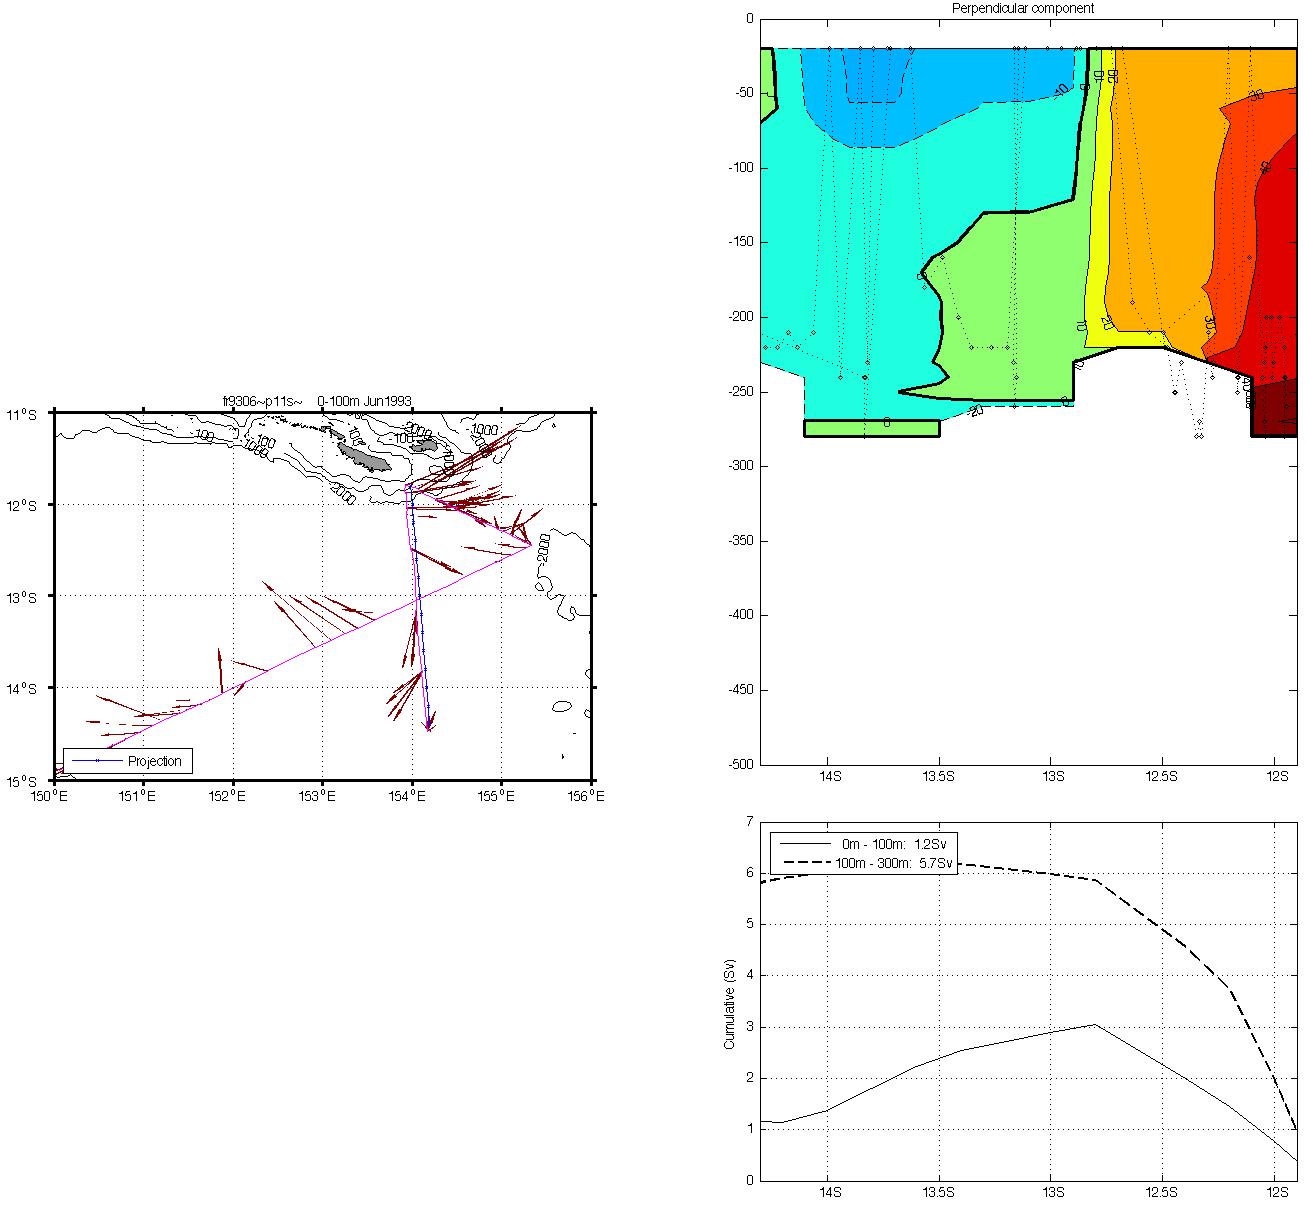
For each strait or segment or interest with sufficiently repeated SADCP data, an average section of the velocity is calculated (see Cravatte et al. 2010) For this, a section is defined (blue track on the map), it is divided into averaging bins (crosses). For each bin, data are collected within a rectangle alongated in the strait direction (or parallel to the coast) and average along-strait velocities (perpendicular to section) are calculated. The purple arrows represent the 0-100m velocity average.
- Vitiaz (15 cruises)
- St Georges Channel
- south (close to mw9303 8 cruises); most tracks are close to the west of the south tip of Cape New Ireland (Cape St Georges);
- south slanted (8 cruises);
- north (6 cruises; essentially Wepocs and fr88)
- Solomon Strait (5 cruises) along-strait velocity
- South of Rossel 154E
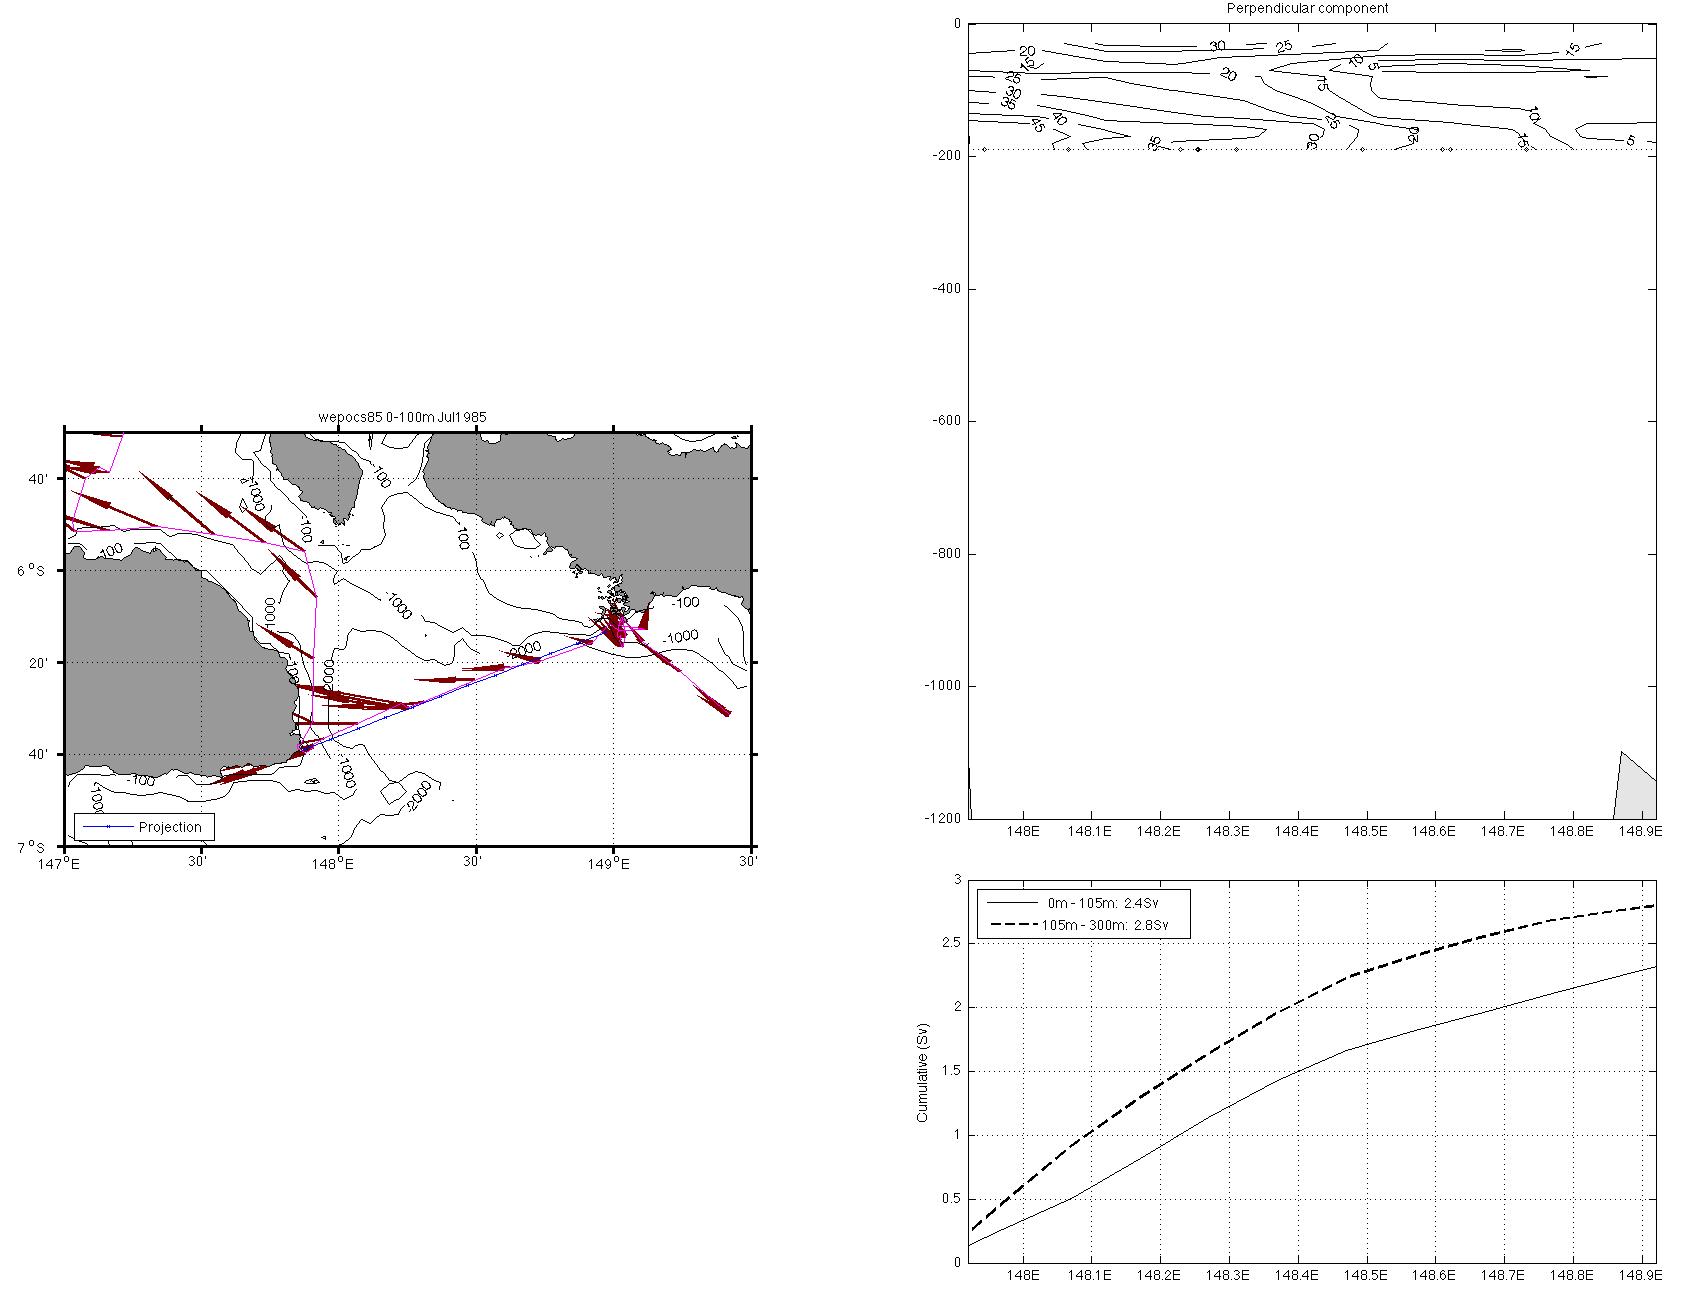
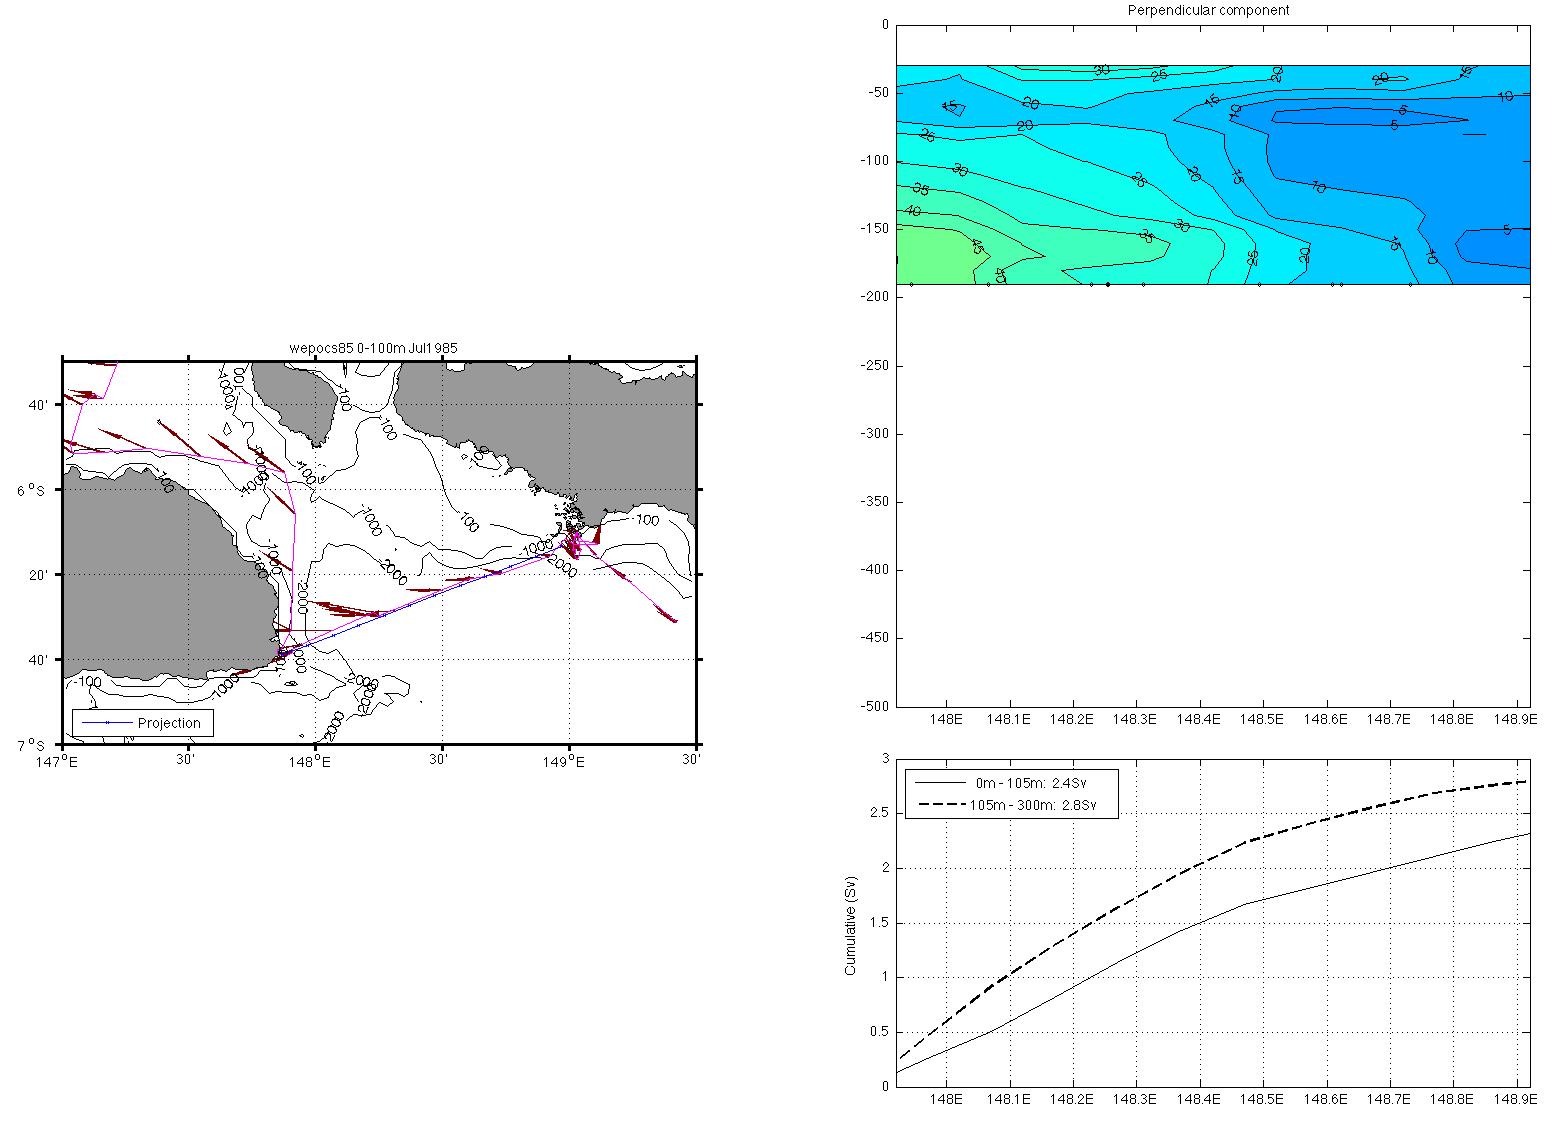
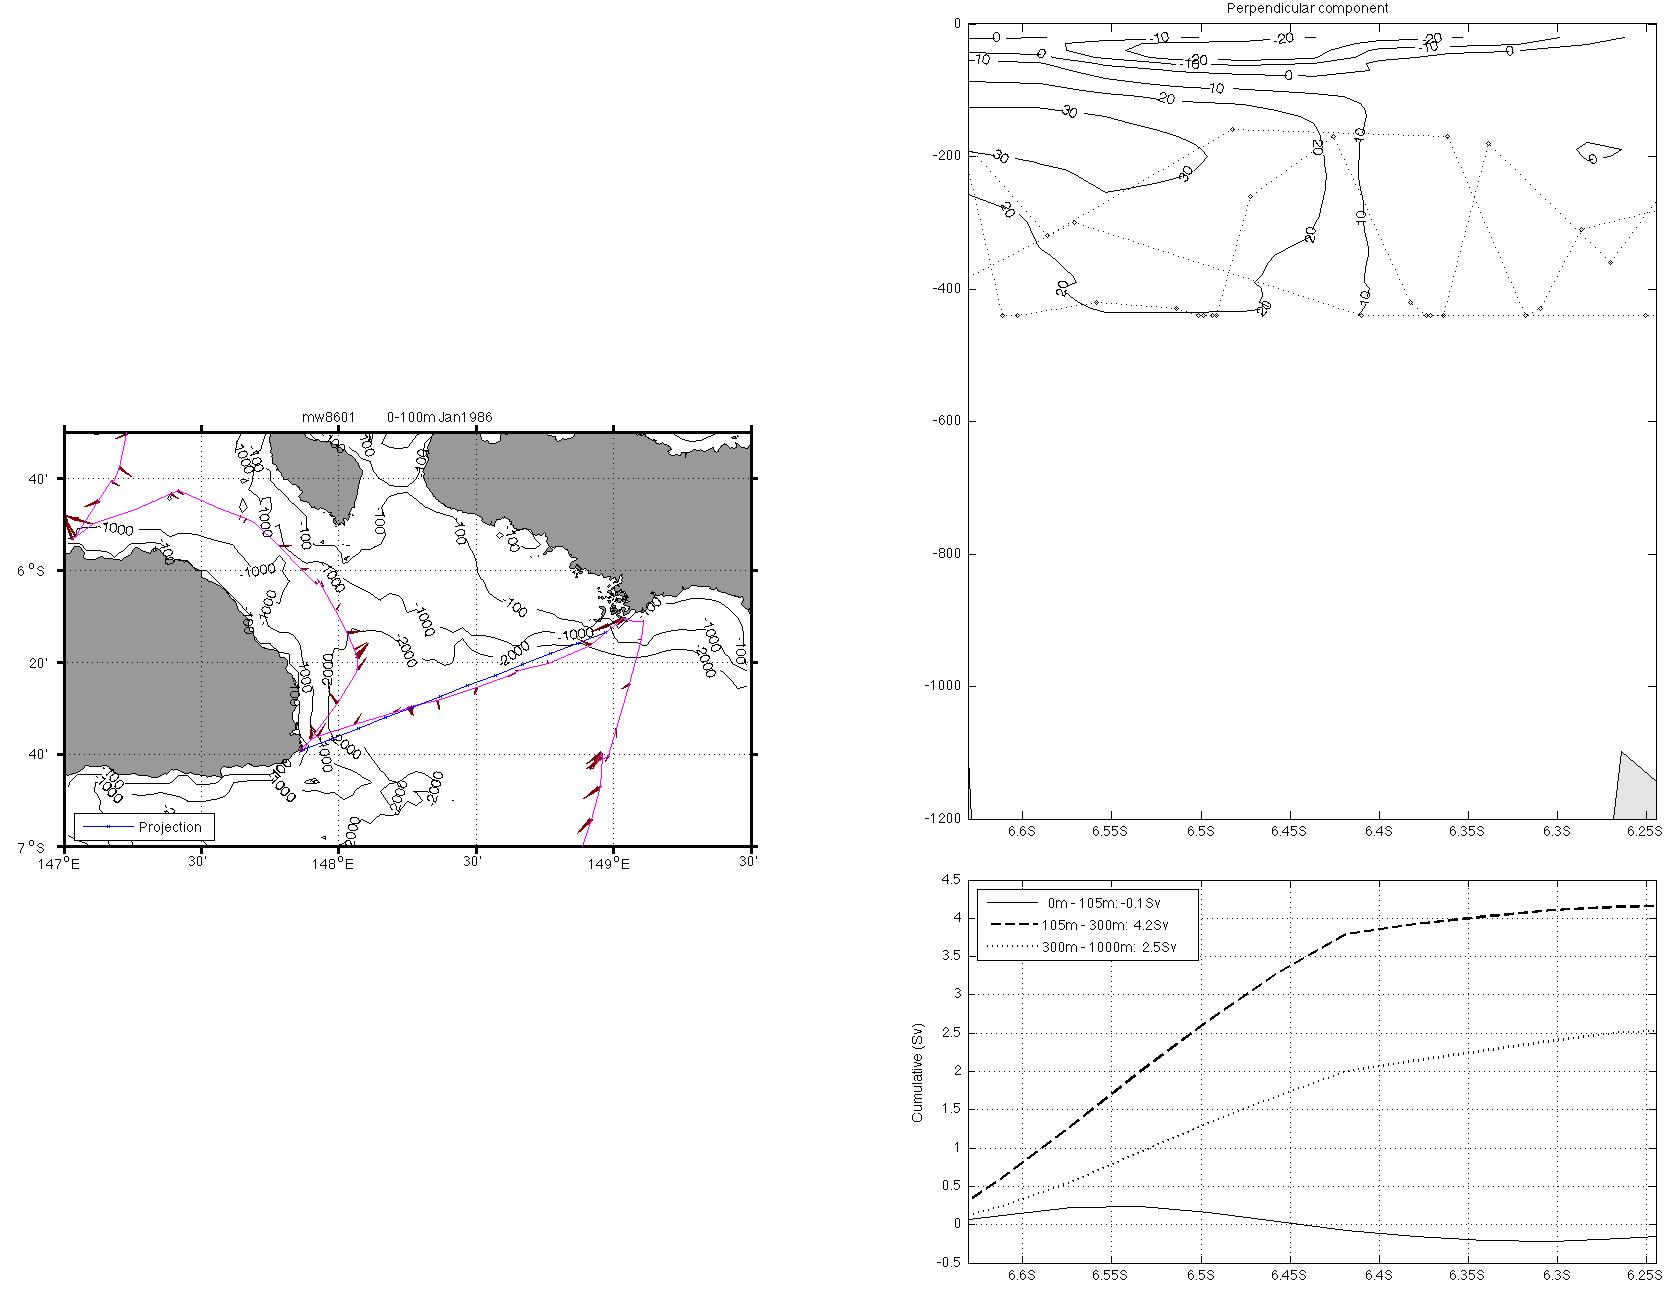
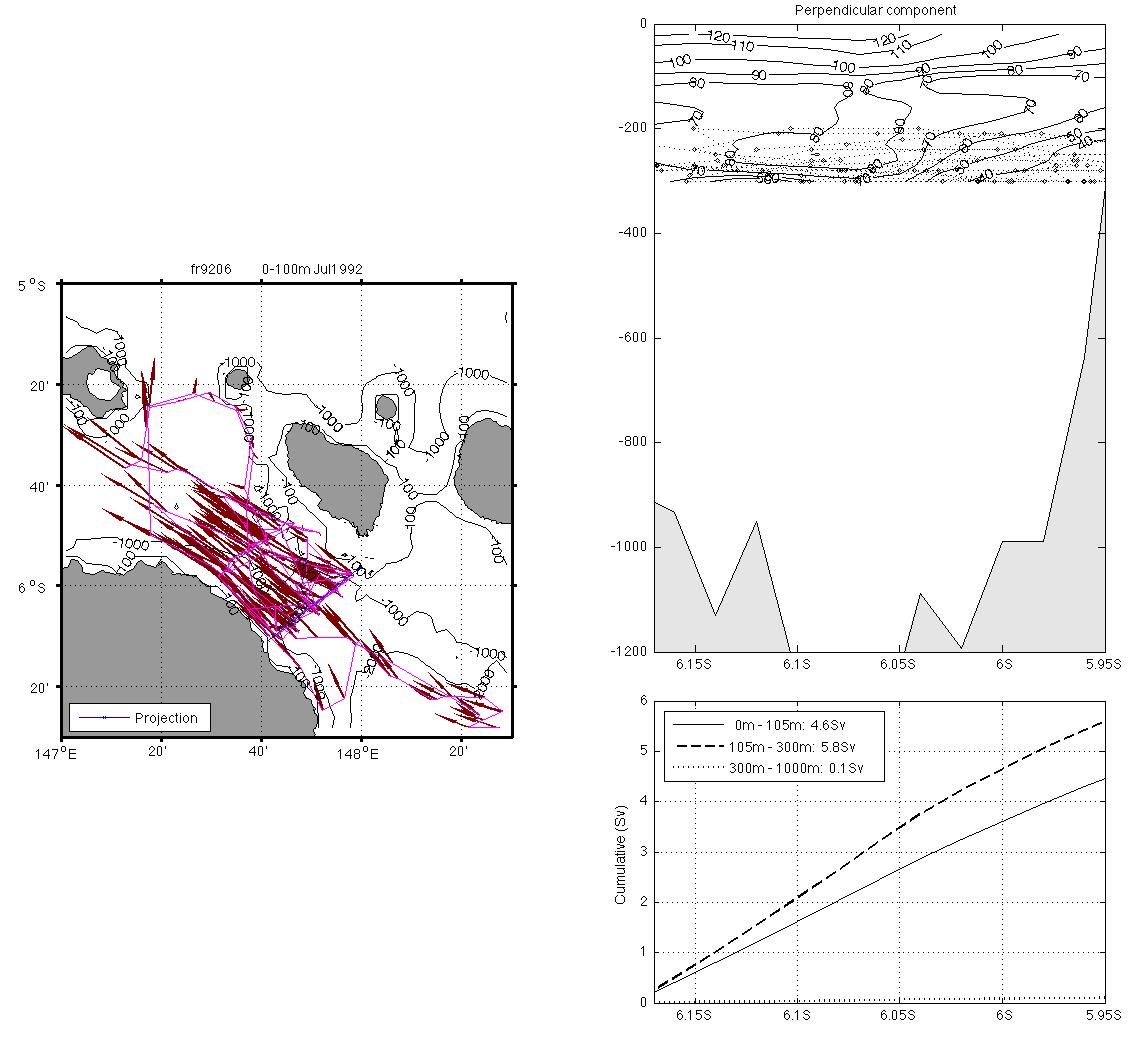
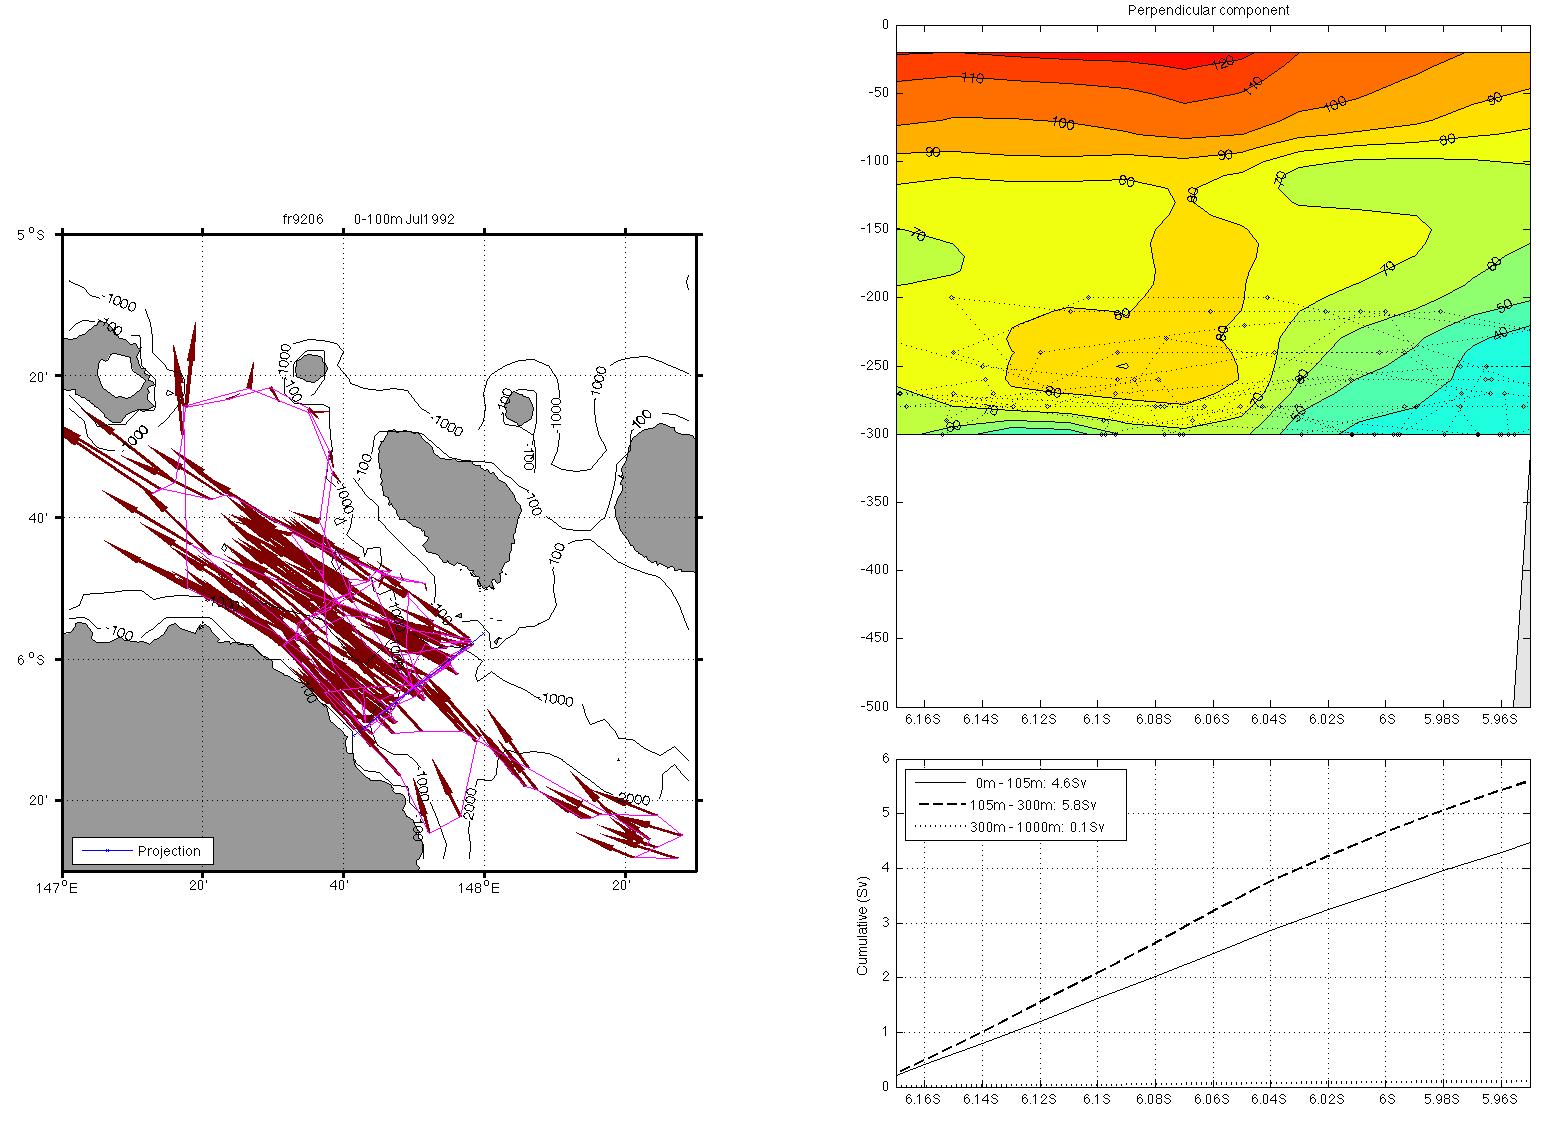
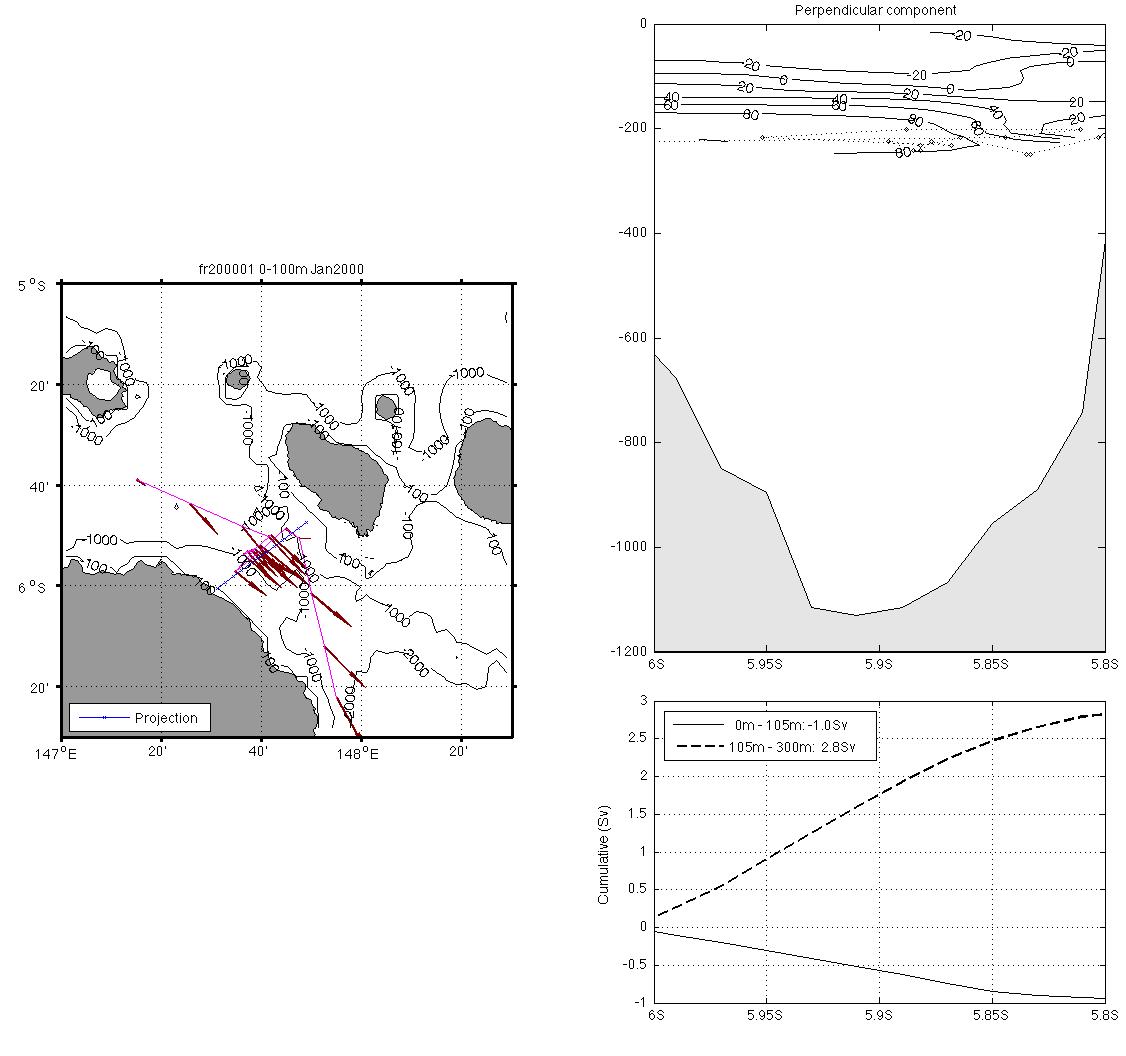
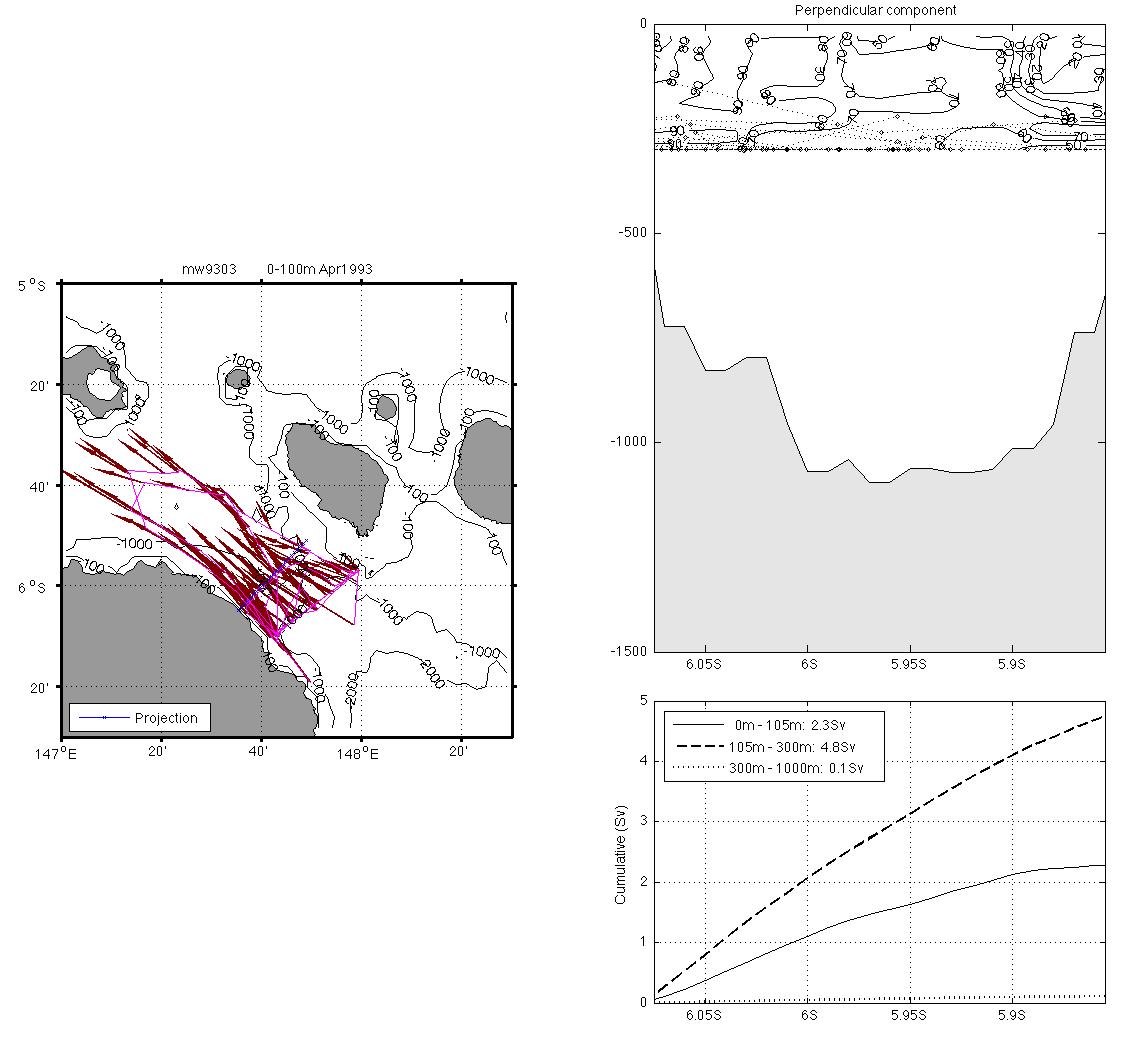
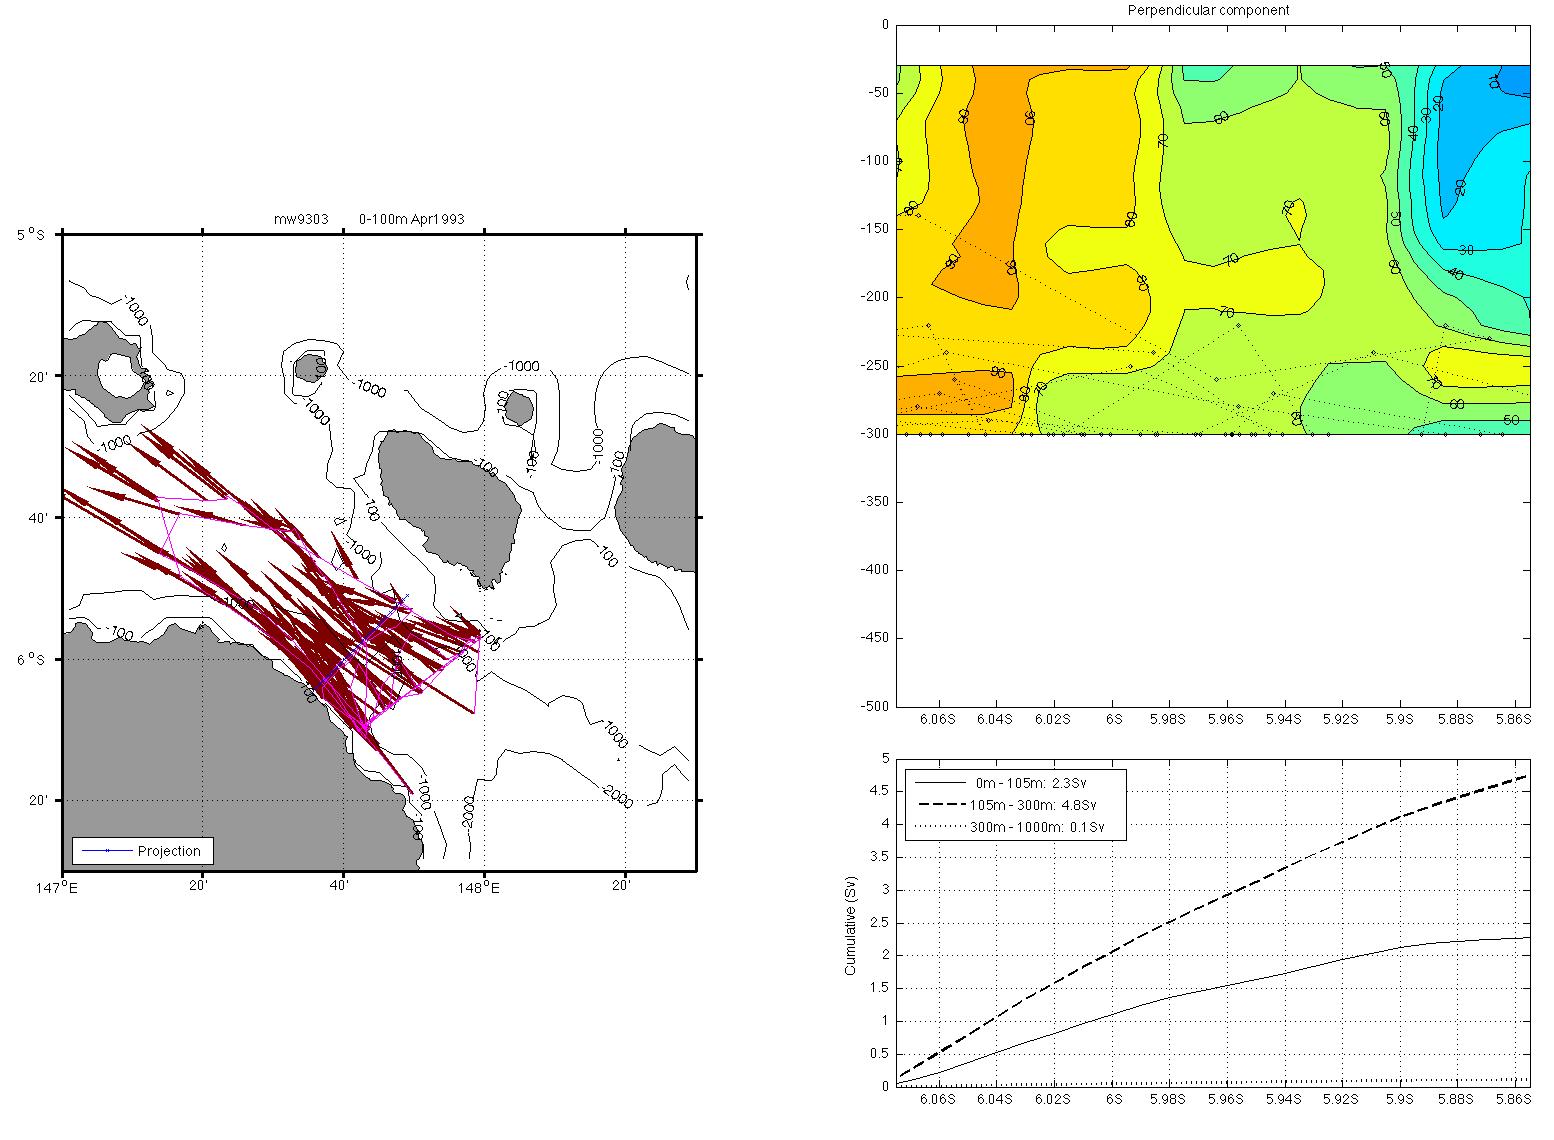
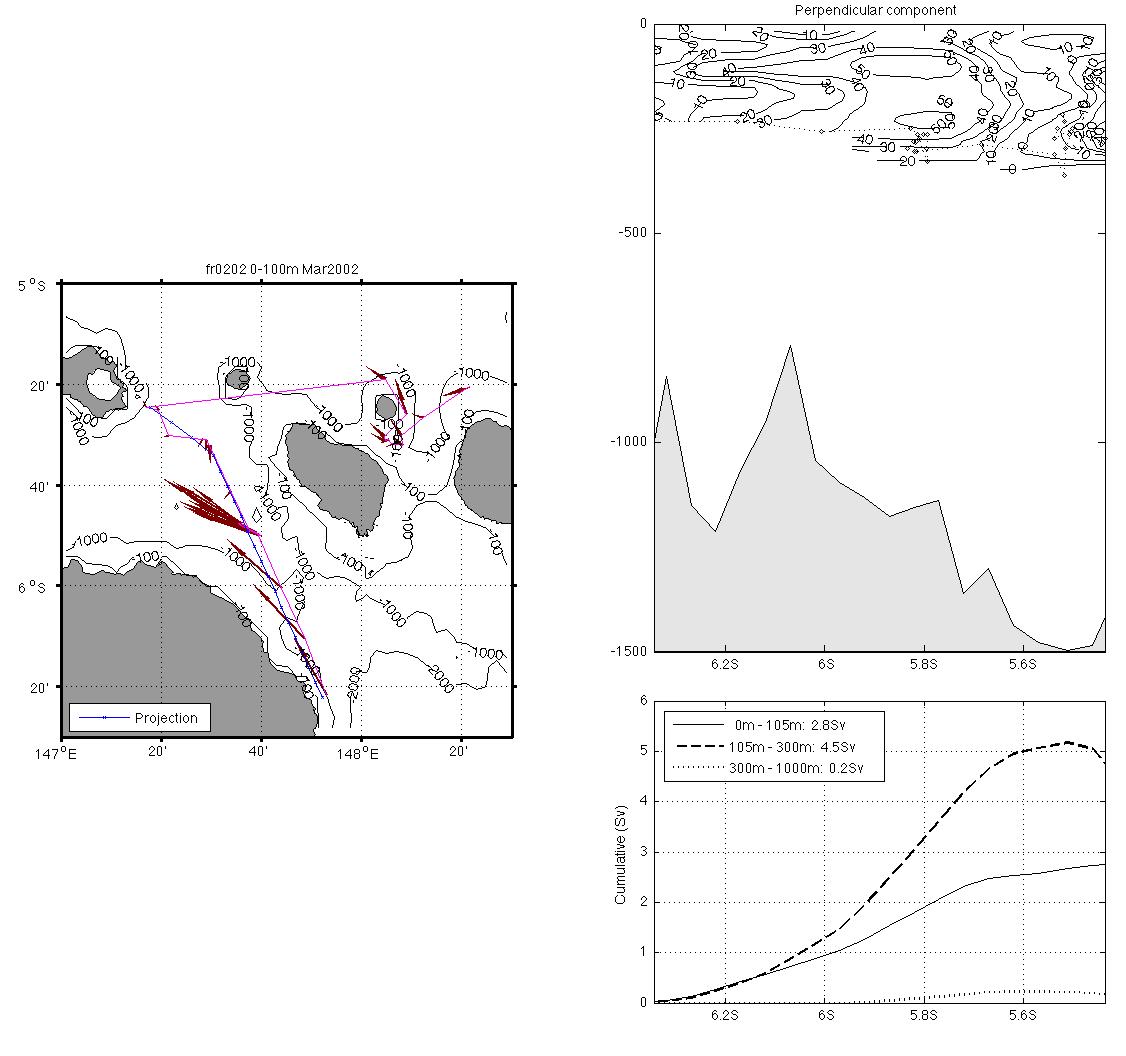
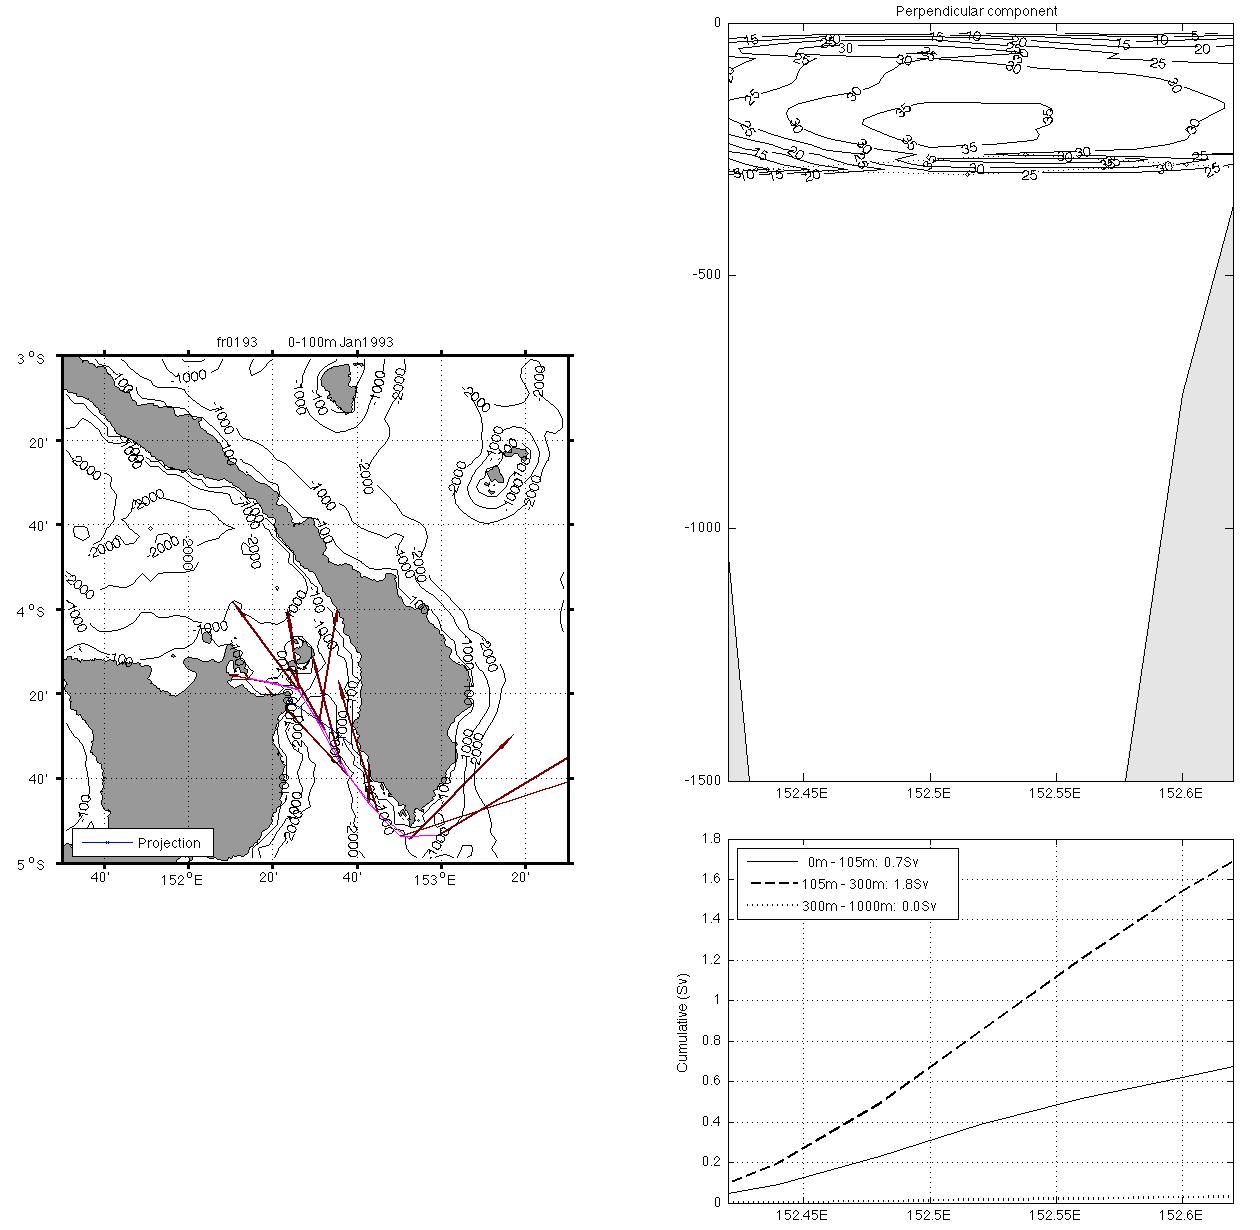
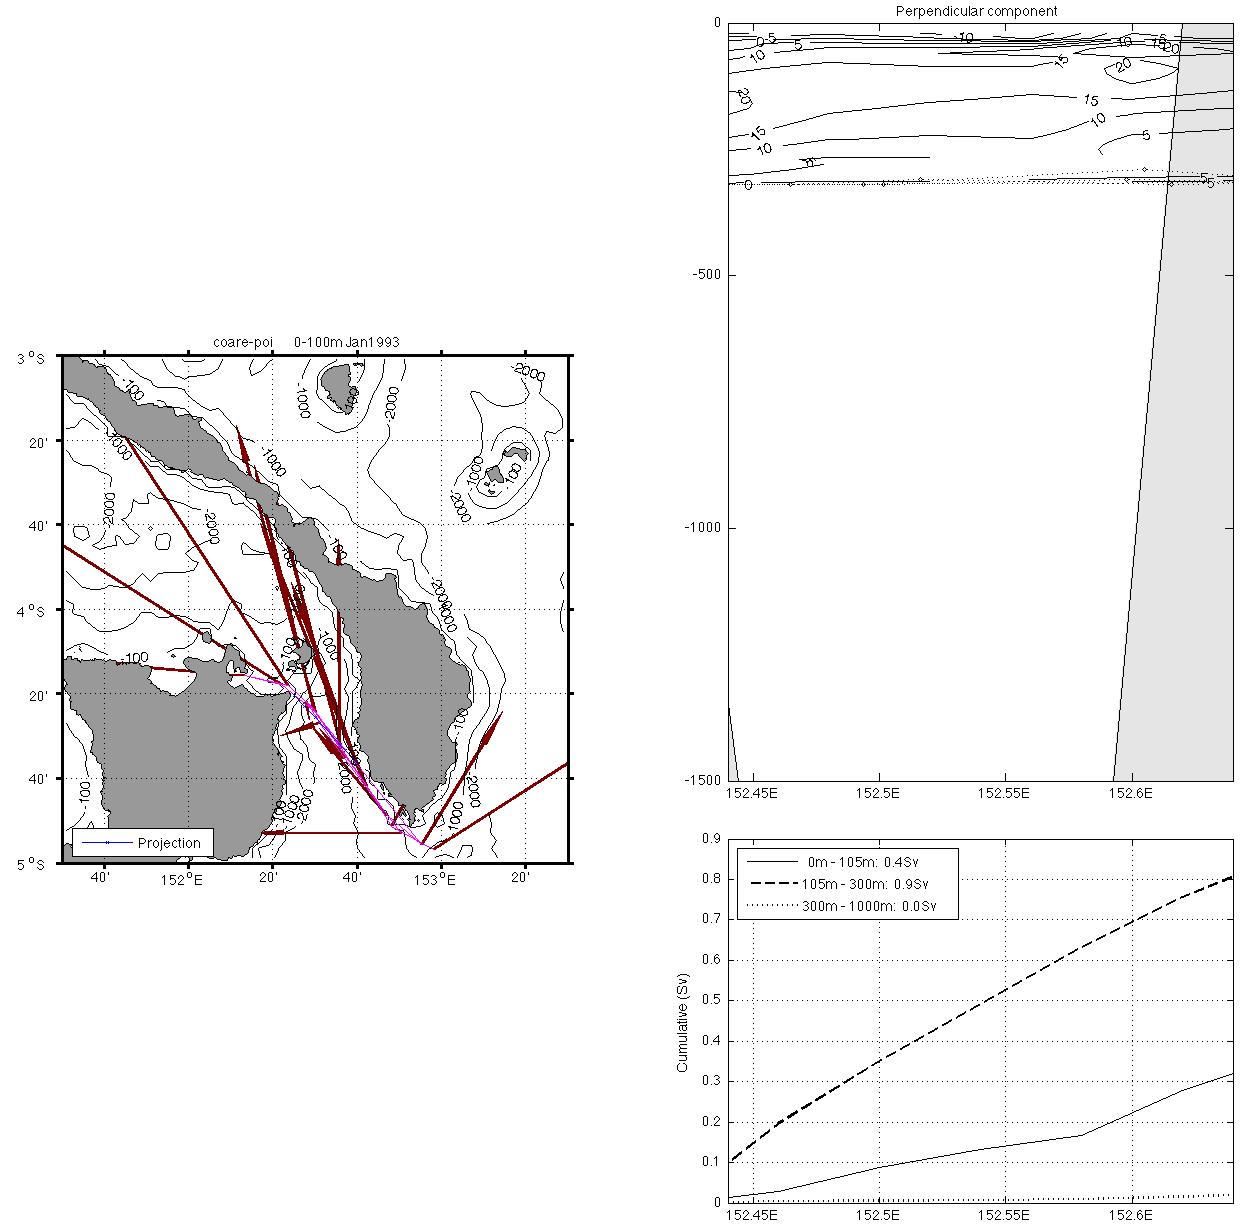
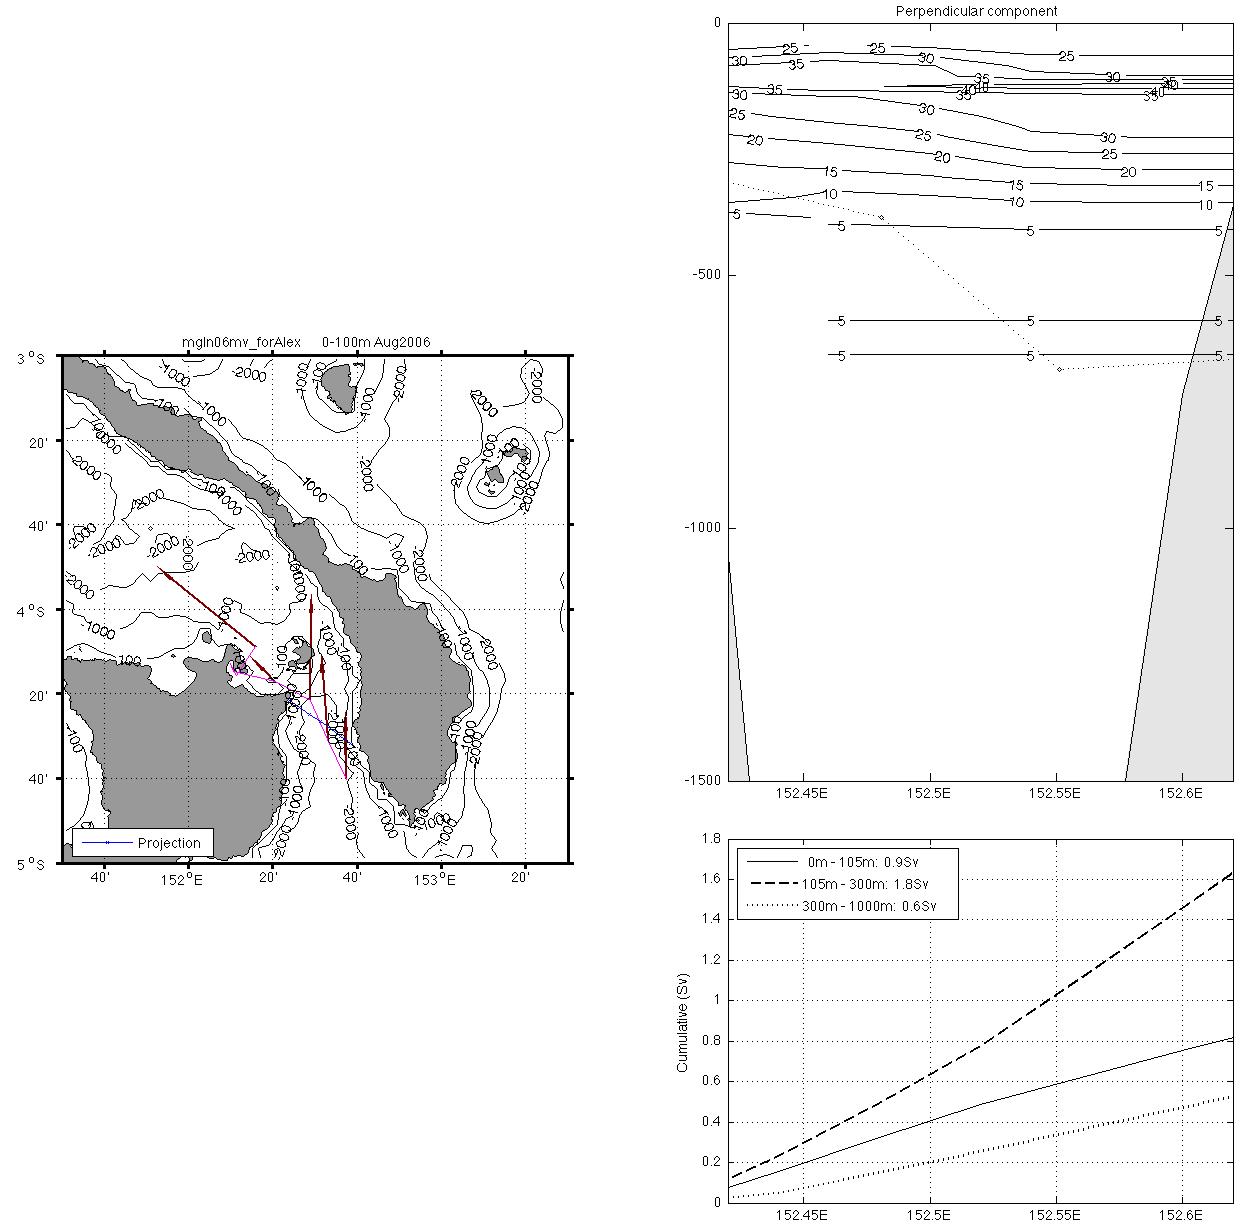
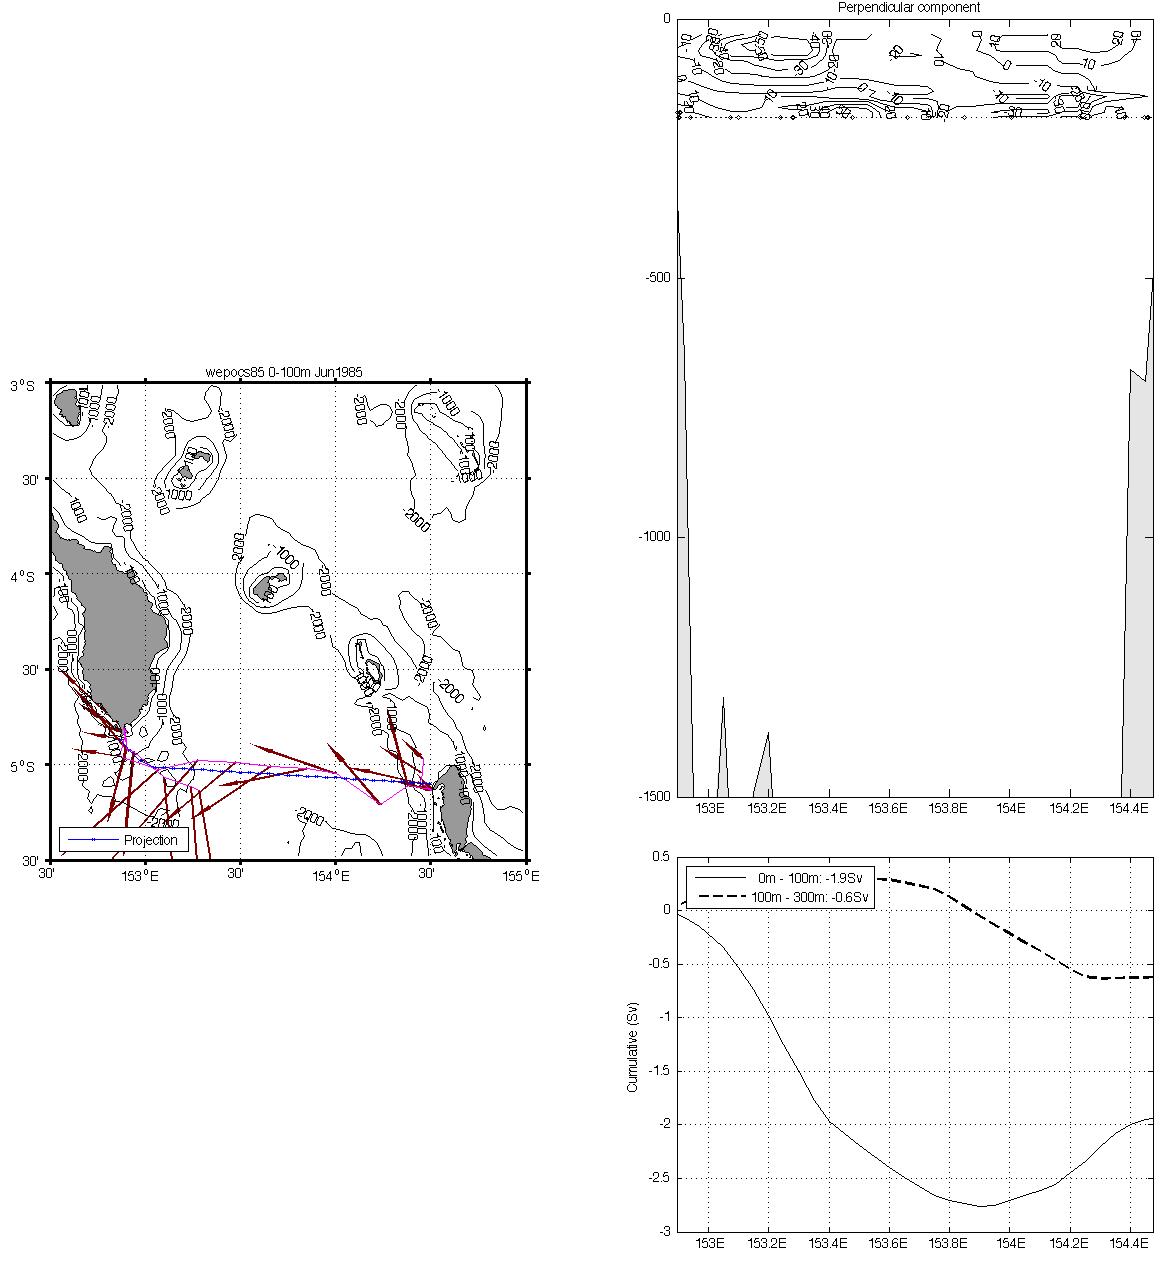
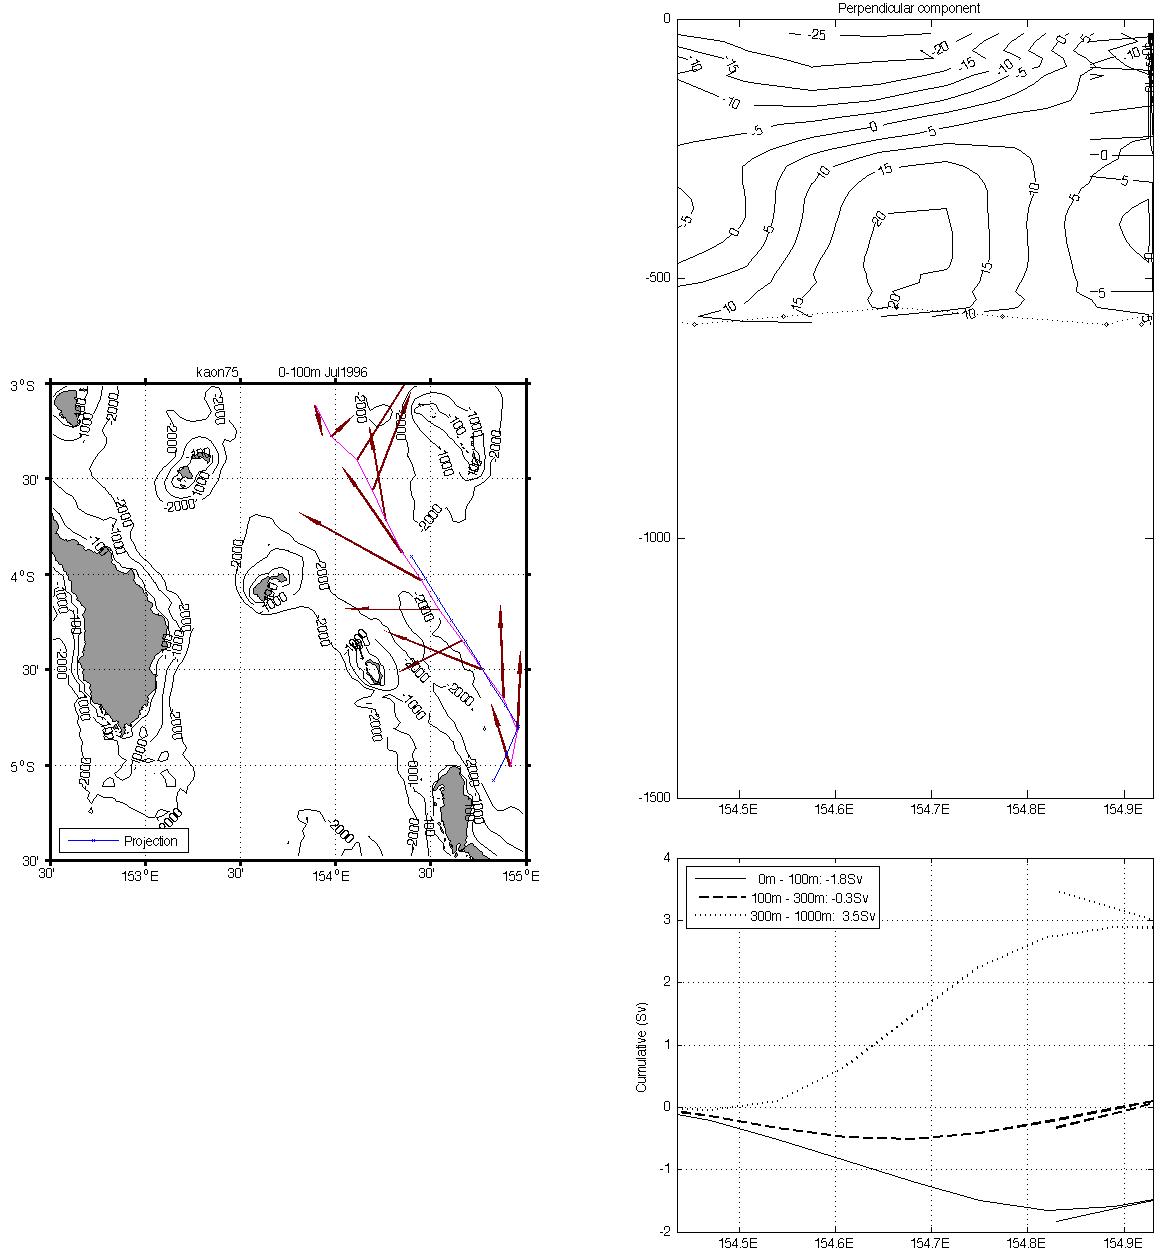
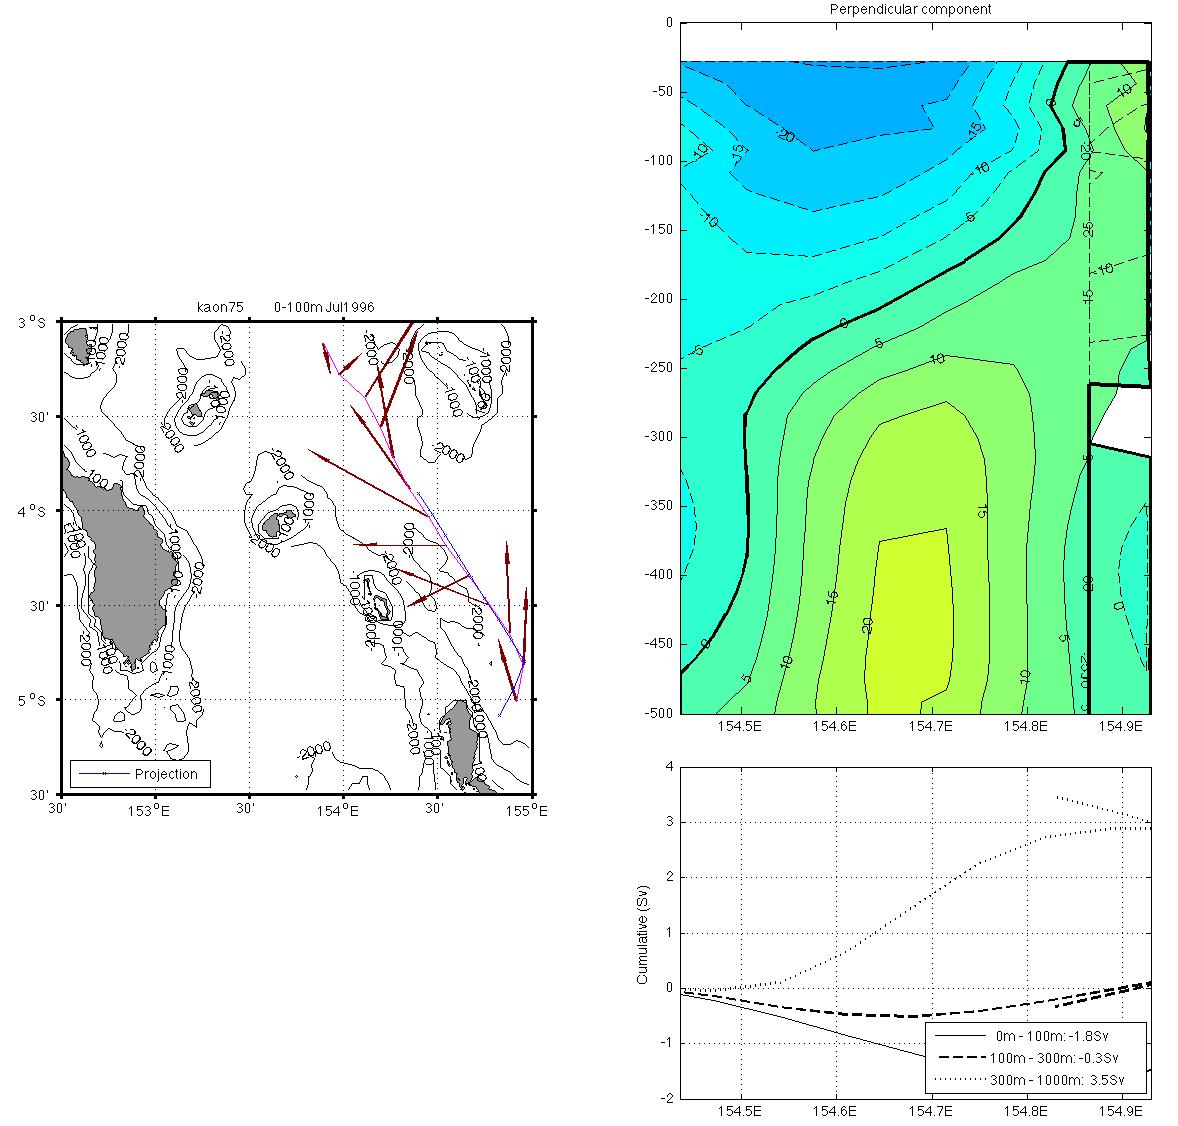
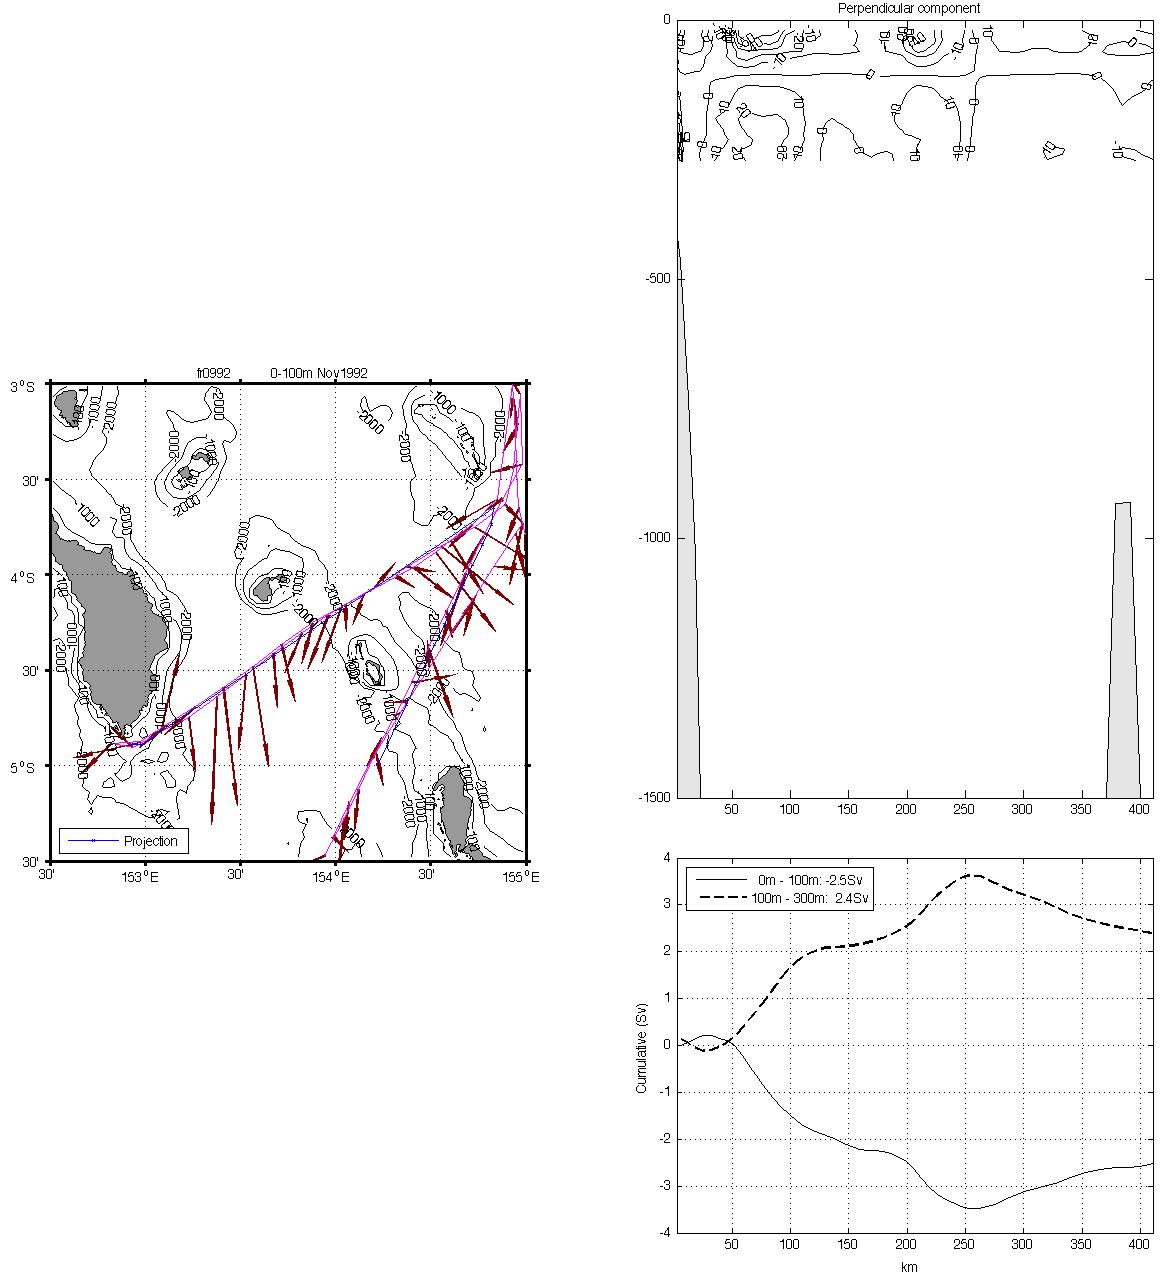
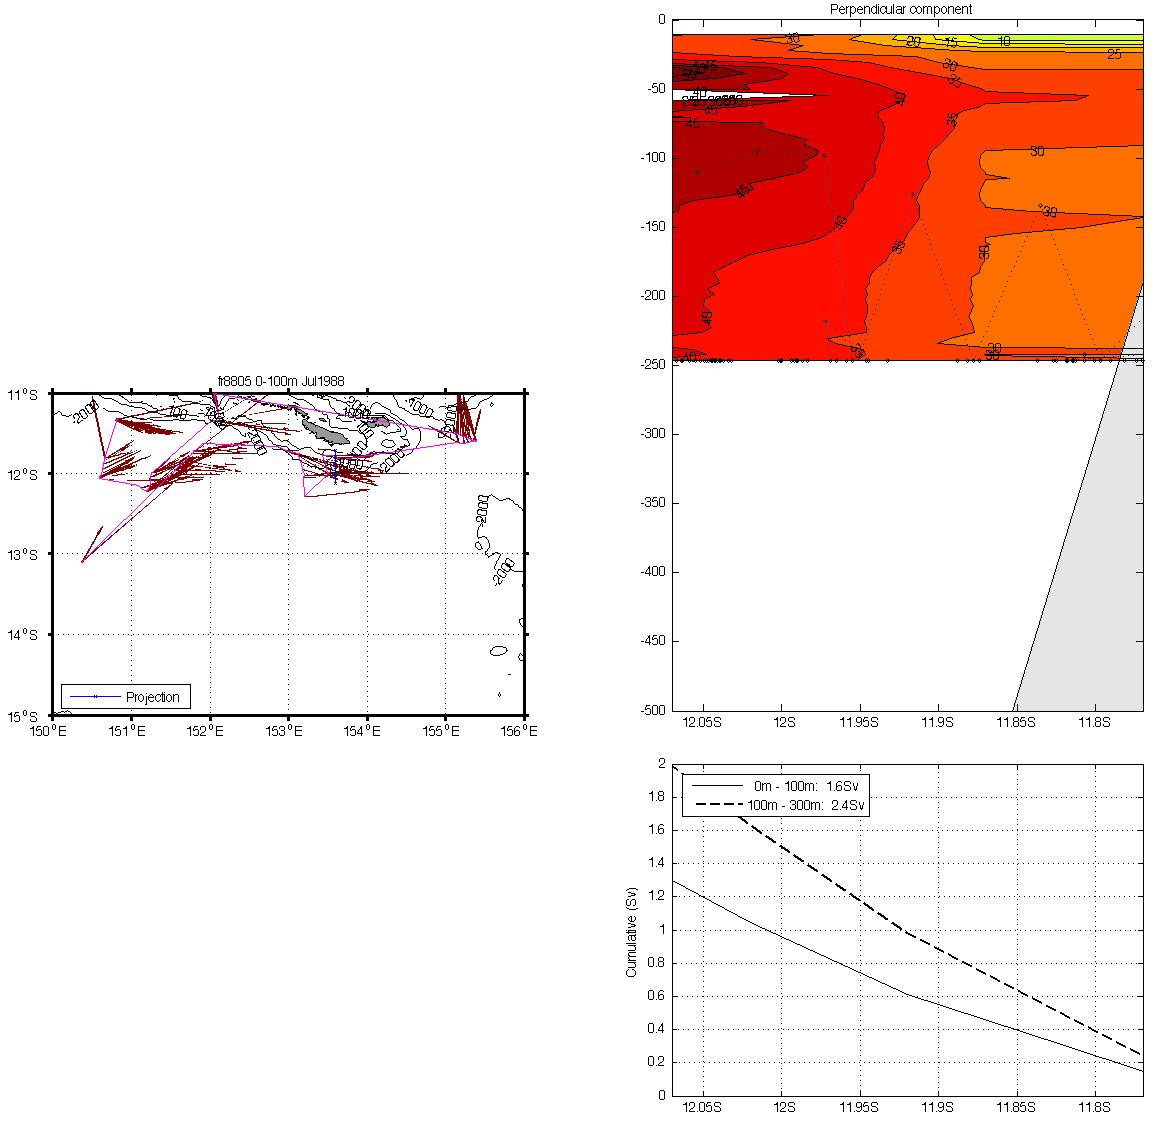
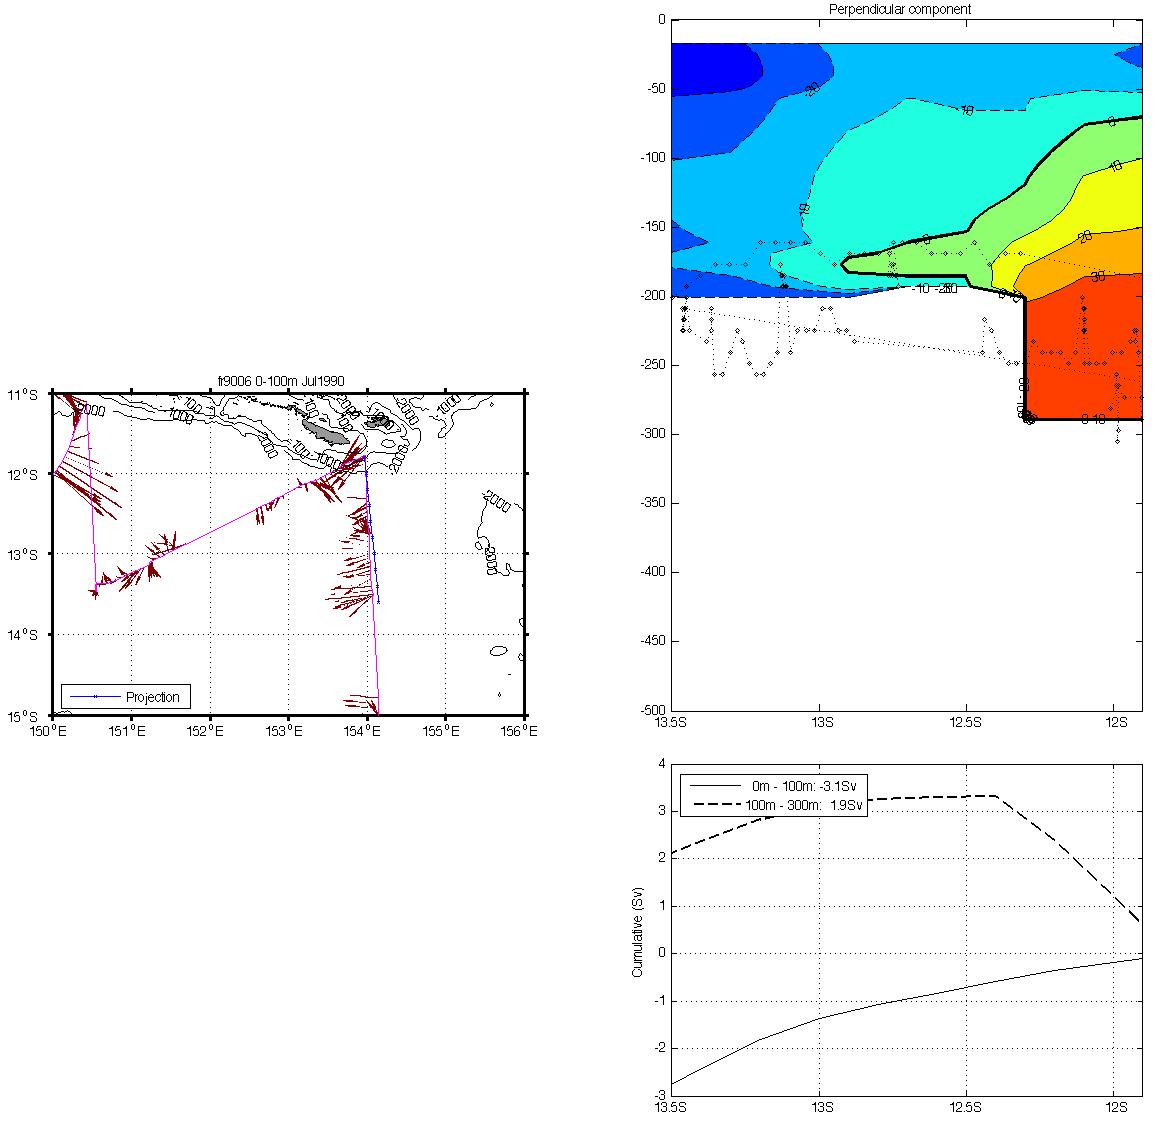
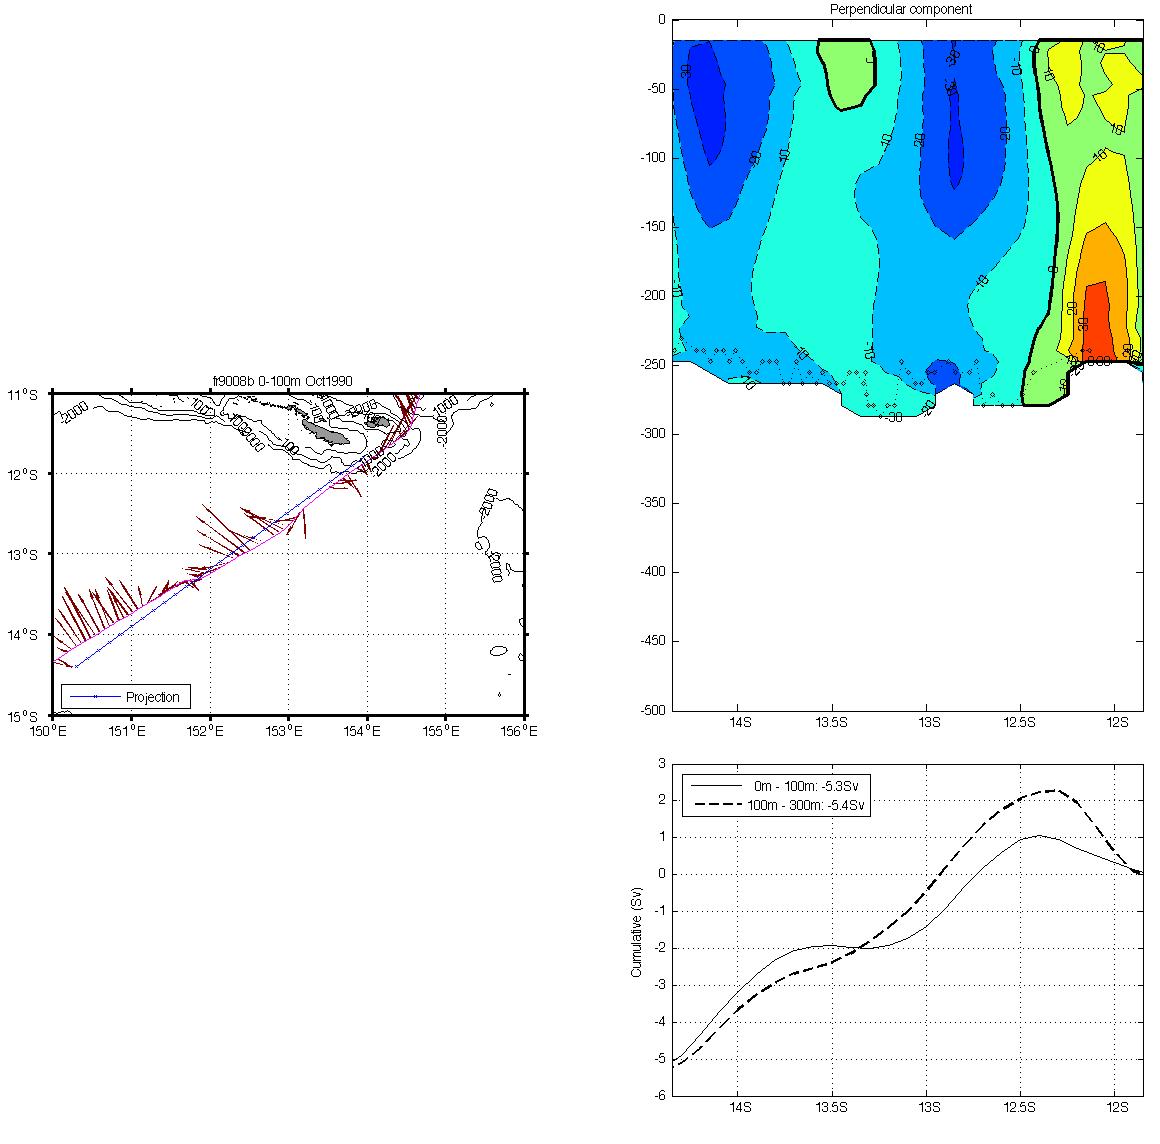
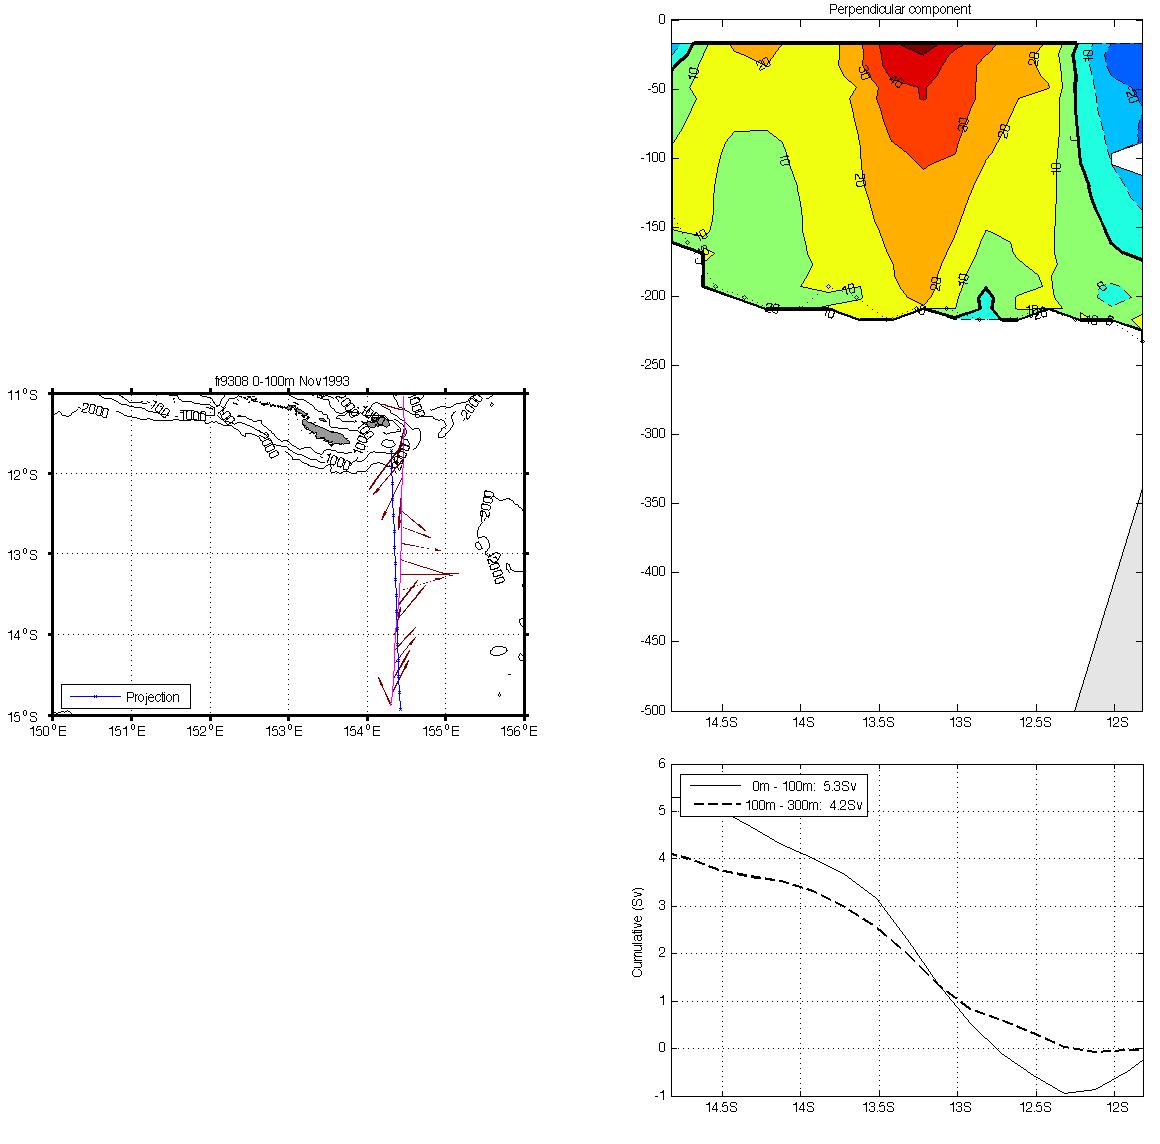
Selected sections and straits
Grouped by seasons; (Nino months=Yellow; Nina months=cyan-from NCEP/NPC). The left panels indicate 0-100m averaged currents along with the section used for projection and averaging of ADCP profiles. The upper right panel indicates the projected velocities, perpendicular to the section. The lower right panel indicates, for each layer, the cumulative transport from the west. A full-depth figure is provided (b&w); a zoom on upper layers (0-500m) and, when possible, a version with tidal currents removed according to Cravatte et al. (2011).
Vitiaz Strait:
| FMA | MJJ | ASO | NDJ |
| wepocs85 c tidecor jul1985 | wepocs86 c tidecor jan1986 | ||
| fr8804 apr1988, c, tidecor | wepocs85 c -fr8507, jul1985 | fr9007, c, tidecor, sep1990 | wepocs86 c MW jan1986 |
| fr9106, c, tidecor, jul1991 | fr9008, c, tidecor, oct1990 | ||
| mw9203, c , tidecor feb1992 | fr9206w, c, tidecor ,jul1992 | ||
| mw9303e c avr 1993 | fr9206e, c, jul1992 | fr200001, c, tidecor, jan 2000 | |
| mw9303w c tidecor avr 1993 | |||
| fr0202, c, tidecor, mar 2002 | IronEuc, c, tidecor, sep 2006 | km419 c tidecor dec2004 |
St Georges Channel
| FMA | MJJ | ASO | NDJ |
| wepocs85 c (MW) jun1985 | fr8507 c (wepocs85) aug 1 1985 | mw8517 c tidecor dec1985 | |
| fr8601 (wepocs86) c feb1986 | fr8804 c tidecor may1988 | wepocs86 c (MW) jan1986 | |
| fr9205 c jul1992 | fr0992 c nov1992 | ||
| mw9303 c avr1993 | mw9304 c may1993 | coare-poi c 1992 coare-poi_1: c Dec15 1992 coare-poi_2: c Jan 10 1993 coare-poi_3: c Jan 13 1993 | |
| mgln06 c aug 2006 | fr0193 c jan1993 |
Solomon Strait
| FMA | MJJ | ASO | NDJ |
| wepocs85 c (MW) jun1985 | mw8601 c jan1986 | ||
| mw9303 c avr1993 | fr9205 c jul1992 | coare-poi :c average: 1992 coare-poi_1: c Dec1992 coare-poi_2: c Jan 9 1993 coare-poi_3: c Jan 13 1993 | |
| k9606 c jul1996 kaon9606 c 1996 | fr0992 c nov1992 | ||
| fr0004 c | fr0193 c jan1993 |
Indispensable
South of Rossel
Jomard Entrance
Ten cruises are passing through Jomard entrance, with an hourly resolution. We plotted the velocities to see if the strong mean current seen in the OI is tidal or permanent. Upper panels show the position of the cruises, middle panel the meridional current, bottom panel the vertical average of the meridional current. The most interesting one is FR8805.